Key Points
- economy depends on Trump 2020 odds
- evaluate efficient frontier as returns over volatility and sharpe ratio
References
| Reference_description_with_linked_URLs_________________________ | Notes___________________________________________________________________ |
|---|---|
| https://seekingalpha.com/article/4296219-analyze-dividend-stocks-14-points?ifp=0 | Analyze dividend stocks - SA article - good coverage of basic metrics, risk analysis |
Key Concepts
How To Analyze Dividend Stocks In 14 Points
https://seekingalpha.com/article/4296219-analyze-dividend-stocks-14-points?ifp=0
In an effort to simplify my investing process, I'm writing this article to highlight as little steps as possible to get a maximum result.
The dividend discount model will tell you how much a company is worth when you consider its ability to pay dividends in the future.
This is a good tool for income-seeking investors or if you want to compare to companies in the same sector.
This idea was discussed in more depth with members of my private investing community,Dividend Growth Rocks.
The ultimate in sophistication is simplicity. I truly and genuinely believe that. I think we are often bored and we reinvent something with more steps and more complex characteristics to feel smart. Once you detail it over a 20-page document with graphs and annotations, you justify your concept's complexity.
But does it have to be that complicated? Can't you just simplify your investing process instead of adding metrics to analyze, steps to complete and ratios to calculate? When it's time to look at a company for the first time, each investor has their own methodology.
In an effort to simplify my investing process, I'm writing this article to highlight as little steps as possible to get a maximum result. Let's see if I can analyze a company with 20 points or less. You can use this article to create your own investing process, modifying some points to fit with your strategy. This list includes both qualitative and quantitative factors.
#1 Business model
If you don't understand how the company makes money, you might as well forget about it. Understanding the business model will help you understanding in which situation the company will do well and when it could get hurt. You will be in a better position to get where the company is going and which strategies will be used to achieve their goals.
The very first thing I do when I look at a new company is to go on their website and read the "about us" description. This will tell me a little bit more about the business, but it is often not enough. Reading the "business description" from financial website such as YCharts or Reuters will usually clarify a few points. Then, I usually head toward the investor presentations section and read their quarterly earnings reports. Those two sources of information will give me additional information to understand fully how the company is making money.
Once I define their business model, I run a classic SWOT (Strengths, Weaknesses, Opportunities, Threats) analysis.
#2 Strengths
The strengths of a company are defined by all tools and characteristics it can use to grow and serve their clients. The list of strength points could include the following:
- Market share
- Strong brand, brand recognitions
- Size and scale
- Perceived quality
- Patents
- Business structure
- Culture
- Management team
- Etc.
#3 Weaknesses
As opposed to strengths, weaknesses could drag the company down. You can also use the strengths list to identify the company's weakness. Keep all factors related to the company only as opportunities and threats that may up.
#4 Opportunities
I define opportunities as growth vectors. Those are areas where the company can thrive and grow their business. It could be a new market, a new trend, a disruptive product, technology evolution, etc. By listing down opportunities, I basically answer the question, "How am I going to make money from this investment?" If there aren't enough opportunities, chances are the company won't make the cut to my portfolio.
#5 Threats
What could go wrong? Is the company dependent on commodity prices? Is it evolving in a cyclical business where periods of revenue growth are followed by plateaus or decreasing investment cycles? As much as fun as it is to define strengths and opportunities, it's even more important to understand the company's weaknesses and potential threats.
Now that we have run through the "soft" part, it's time to look at cold hard numbers. Let's see how key metrics can tell you what you need to know about a company.
A word about metrics first
Before I share with you the list of metrics I use to analyze stocks, I'd like to highlight that metrics only tell you what already happened. Metrics are like raconteurs telling you about a great story. They can give you some guidance to predict the future, but it's not always accurate.
Also, it is very easy to add up metrics to your list and end your day with 50+ points to check. I make sure to keep about a dozen key metrics and ignore the rest. This is my trick to avoid "paralysis by analysis." I'm not saying those metrics are the only good ones, but they are my preferred indicators. This all starts with the first component of the dividend triangle: Revenue growth.
#6 Revenue Growth
The very first metric I like to see when I discover a company is its revenue trend over the past 10 years. The way revenue fluctuated through a decade will tell me a lot about where the company is going and how stable its sales are.
After all, the very first goal of any business is to grow. If the business is successful, it will translate into revenue growth. I don't really like to see the percentage number over 3, 5, or 10 years. I prefer to the see the trend on a graph. Let's take Lockheed Martin (NYSE:LMT) for example:
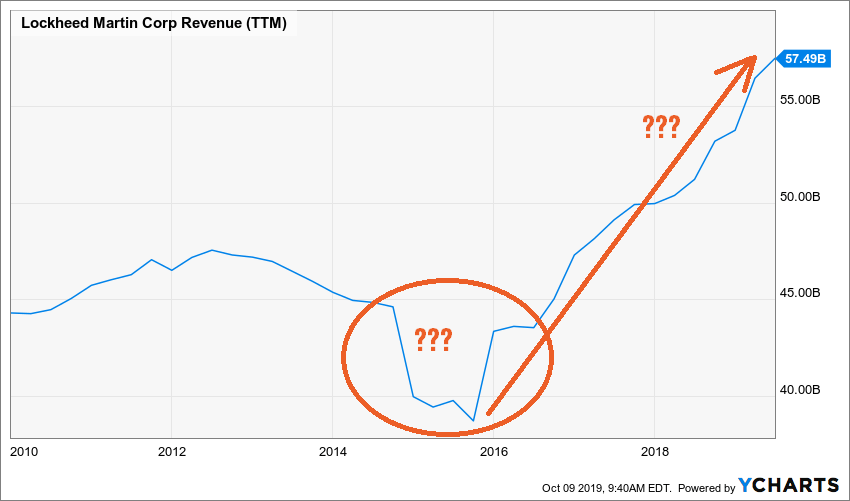
Source: YCharts
As you can see, there is an important revenue drop in 2015 followed by an irresistible growth. Both phenomena need to be explained. The graph will tell you which year to look at and then you can go to the annual report or the quarterly statements to understand what is going on.
#7 Acquisitions or organic growth?
Growth isn't always explained the same way. When you see a steady revenue trend, you can imagine this is due to organic growth. Organic growth happens when the company evolves in a growing market or increases its market shares due to new or superior products. For example, the number of people with diabetes keeps growing. If a company offers one of the best diabetes treatments, chances are it will enjoy strong organic growth.
The other way to increase sales is through acquisitions. If the company hasn't developed a new product or service, it can acquire a competitor which did. Another way to grow a business through acquisitions is to integrate a client or a supplier. When there is a big jump in revenue, it is usually linked to a major acquisition. Then, you must track the company's debt level.
#8 Long-term debt
Debt isn't a bad thing per se. In fact, if management can use leverage wisely, it can grow faster and make shareholder richer. Similar to revenue, the number or the percentage doesn't matter much to me. What I really want to see is the trend (and then the story behind it). Let's take a look at AT&T (NYSE:T) for example:

Source: YCharts
You can see that between 2014 and 2019, T's long-term debt has more than doubled. This is explained by major acquisitions combined with massive investments in 5G technology. Please note that in 2019, management started to repay that debt and aims at reducing its burden going forward.
Is this huge amount of debt scary at first? Definitely. Does it mean it's bad? It depends. One must go and look for the story and understand why the company went into so much debt. In this specific case, you might think AT&T is doing the right thing as it aims at growing its cash flow through its acquisitions and the development of the 5G technology. Another aspect you can use to define if the level of debt is high or not is to use the debt-to-equity ratio.
#9 Debt-to-equity
Here's YCharts' definition:
Leverage ratio indicating the relative proportion of shareholders' equity and debt used to finance a company's assets. A low debt to equity ratio indicates lower risk, because debt holders have less claims on the company's assets. A debt to equity ratio of 5 means that debt holders have a 5 times more claim on assets than equity holders.
A high debt to equity ratio usually means that a company has been aggressive in financing growth with debt and often results in volatile earnings.
It is also known as Debt/Equity Ratio, Debt-Equity Ratio, and D/E Ratio.
When you look at AT&T's debt-to-equity ratio over the same period, you will notice the debt increase isn't as impressive.
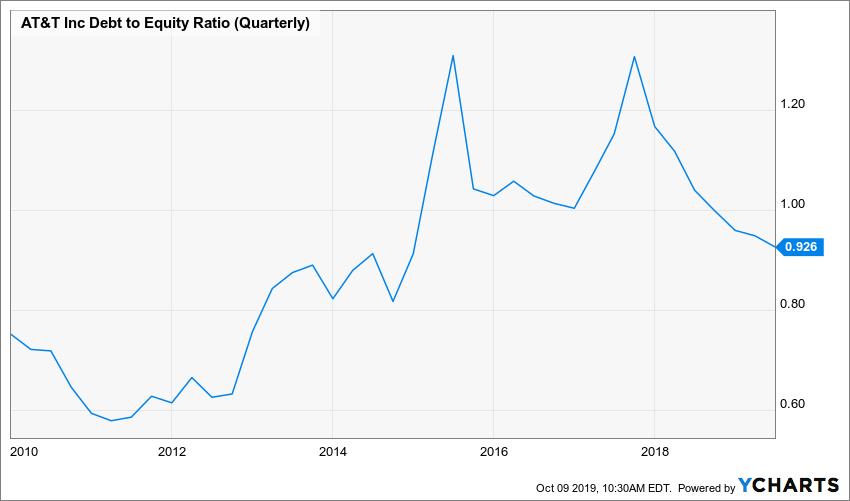
Source: YCharts
The company is still more indebted than it was, but you can see it starts to reduce compared to AT&T's equity level (this is mainly due to a stock price increase).
#10 Earnings Growth
Growing sales is interesting only if the company manages to grow its earnings at the same time. The second component of my dividend triangle is earnings growth. Then again, I prefer to look at the 5 and 10 years' trend than growth numbers. Earnings per share (EPS) is my favorite metric to see if a company is making more profit. Keep in mind the EPS is based on accounting rules and sometimes it gets tricky. Let's look at Microsoft's (NASDAQ:MSFT) EPS over the past 10 years:
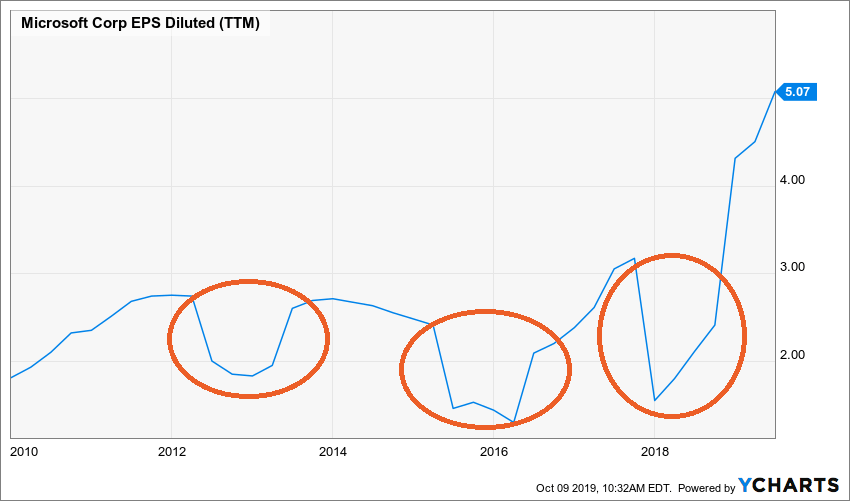
Source: YCharts
As you can see, the company shows multiple EPS drops over the past decade. Did the company really lose that much money from time to time? Not really. In fact, most of those earnings gaps have been generated by accounting rules, not real money coming out of Microsoft's bank account. Each important movement is another invitation to investigate further. A good way to see if the company is making more money is to combine this information with cash flow metrics.
#11 Cash flow metrics
Let's look at MSFT's cash flow from operations trend:
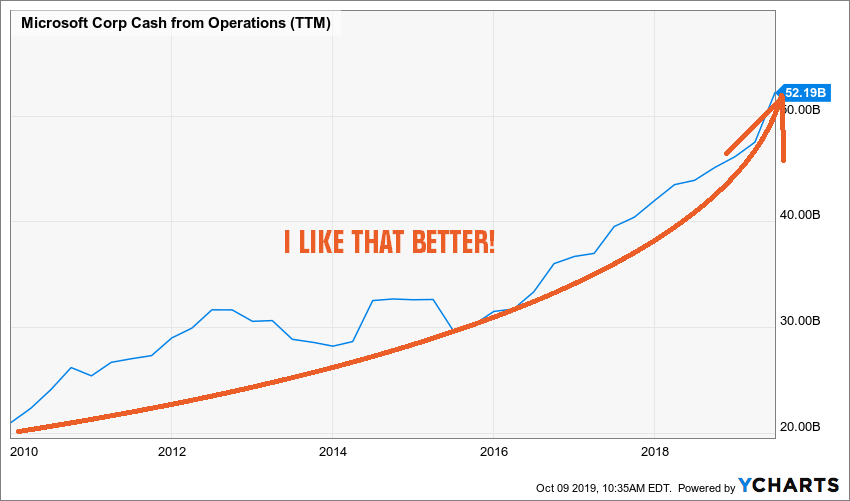
Source: YCharts
As you can see, the company is generating more and more cash flow from its business. This tells you that your dividend is likely going to increase and share price is likely going to go up (and probably did already). If you want to go even deeper, you can pull out the free cash flow metric.

Source: YCharts
Cash from operations is seen as "how much the company generated throughout its business operations," while free cash flow is defined as the amount of cash generated by a business that is available for distribution among its security holders. The formula is a little bit more complicated, but you get a "cleaner" and more specific result.
Net Income
+ Depreciation/Amortization + (Interest Expense - Interest Income) * (1 - Tax Rate)
- Changes in Working Capital
- Capital expenditure
= Free Cash Flow
#12 Dividend growth
While the dividend growth is sitting as #12 out of 14 points to analyze stocks, this is my favorite. If there is one metric to look at, it's the dividend growth over the past five years. Why? Because this is the ultimate end results.
If a company is a leader in its market and grows both its sales and earnings while maintaining a healthy level of debt and generating consistent cash flow, guess what management will do? That's right! It will increase your paycheck.
Whenever I hesitate between 2 and 3 stocks, I'll simply pick the one with the strongest dividend growth. You probably guessed it by now, dividend growth is the third point of the dividend triangle. It's also the foundation of my 7 dividend investing principles.
Once again, when you analyze dividend growth, go for the graph over the past 5 or 10 years. You'll see if there was a big jump at one point or if management consistently increase its payouts by 5-7% yearly. I prefer the latter for obvious reasons.
A strong and stable dividend increase throughout time is a sign the company is healthy. It's also a sign that management is quite confident in paying (and increasing) its dividend going forward. Keep in mind that while the dividend policy isn't an obligation (dividends can be cut at any time), it is still part of a "pact" between shareholders and the company. Breaking it would not have a good outcome on share price. Ask General Electric (NYSE:GE) shareholders what they think:
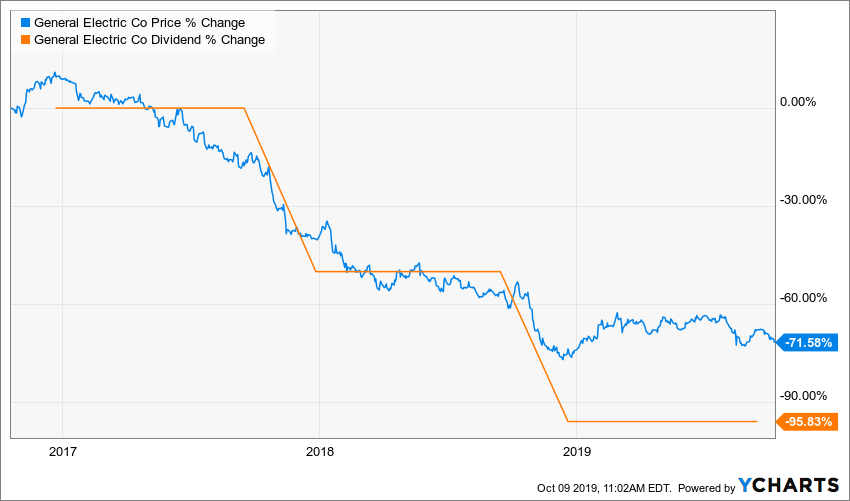
Source: YCharts
By the time you get to analyzing the dividend growth trend, you probably have a good idea if the company and keep up with its dividend policy. Revenue, earnings, cash flow and debts are all metrics that will tell you if the dividend is sustainable. But there is one metric that tells you right away. It's called the payout ratio.
#13 Payout ratio(s)
By definition, the payout ratio will tell you how much of earnings per share (EPS) is used to pay the company's dividend. Therefore, if a company posted an EPS of $4.00 and distributes a dividend of $1.00 per share, its payout ratio is at 25%. A good payout ratio is usually behind 80-85%. However, it is a lot more complicated than this.
First, remember that whenever you use earnings or EPS, you are using accounting numbers, not real cash. Then, the payout ratio may fluctuate or seem very high for a period of time where the company had to record a non-cash charge in their financial statement.
Using the cash payout ratio could be a good alternative. However, this is a little bit more complicated to calculate and many websites don't offer it. I use YCharts to obtain that number. Here's the formula if you want to have fun:
Cash Dividend Payout Ratio = Common Stock Dividends / (Cash Flow from Operations - Capital Expenditures - Preferred Dividends Paid).
Second, there are several other ways to calculate the payout ratio. Depending on which type of companies you analyze, you will sometimes have to use the Net Interest Income (NII) payout ratio (for BDCs) or the Distributable Cash Flow (DCF) or even the Funds from Operations (FFO) or Adjusted FFO (AFFO) payout ratios (for REITs). In those specific cases (especially when the classic payout ratio seems completely off), I suggest you look into the quarterly earnings of the company. Management will outline which metrics it uses and how to calculate it.
#14 Valuation?
Yup, the last point of analysis is valuation. I have written many times about stock valuation and how it should be a tiny part of your analysis process. I personally use two types of valuation technique once I really like a company. Most of the time, I use the result of my valuation analysis to compare two or more stocks in the same industry. This is how I will pick the one for my portfolio.
P/E Ratio & FWD P/E Ratio
The first technique is quite simple. I look at the past 10 years of PE history and combine it with the forward P/E ratio. This simple valuation model will tell me how the market values a company over a full economic cycle. Let's take a look at Disney's (NYSE:DIS) chart:

Source: YCharts
This is an interesting chart as it tells you how the market got very excited (ESPN growing, streaming services, blockbuster movies, etc.) and sometimes very depressed (customers cutting cable, fear or recession, etc.). As the stock is trading at a forward P/E of nearly 22, you can tell the market is currently hyped about DIS. Is this the time to buy? By looking at this graph, you may have to be patient if you are looking for stock appreciation. Yet, I love Disney as a business.
Dividend discount model (DDM)
The second valuation model I use is a little bit more complex. The dividend discount model will tell you how much a company is worth when you consider its ability to pay dividends in the future. This is a good tool for income-seeking investors or if you want to compare to companies in the same sector.
Analyze companies like a PRO
If you read this far, congratulations! This was a long article with lots of metrics and technical terms. This article was meant to give you a complete analysis process for you to use. The idea is to focus on a smaller number of metrics to become more efficient. You could add another 50 metrics/factors to look at, but all you would do is add up to the pile and get paralyzed by analysis. Keep things simple and focus on concise information. This is how pros do it.
Potential Value Opportunities
Potential Challenges
Candidate Solutions
Step-by-step guide for Example
sample code block