add a label tag ( above ) so this page shows on the correct menu page
what are the key reference items for this article?
| Reference_description_with_linked_URLs_____________________________________ | Notes_________________________________________________________________ |
|---|---|
| https://code.visualstudio.com/download | VS Code open source |
| https://code.visualstudio.com/docs/?dv=osx | VS Code tips |
https://code.visualstudio.com/shortcuts/keyboard-shortcuts-macos.pdf | VS Code default shortcut keys insert at cursor ? try just "i" - like vim keyboard map = cmd K cmd S |
| https://visualstudio.microsoft.com/vs/msft-android-emulator/ | free emulator but runs only on Windows for Android app testing may not be well supported |
| https://visualstudio.microsoft.com/dev-essentials/ | Microsoft Visual Studio plus tools that are free and some trials |
https://www.azuredevopslabs.com/labs/vstsextend/appcenter/ https://drive.google.com/open?id=1zvrhRDINBPRKeITLmyf_hOQM6e-9Bgzm | Microsoft Visual Studio App Center << Does not cover Linux apps - see VSCode >> |
vscode-keyboard-shortcuts-macos.pdf

since this editor was opened from Github Desktop, you can see the changes there before publishing to Github again

While the changes are locally available in the repo, they have not been pushed to the master branch in Github ...

This repo exists locally so changes can be made there before pushing to the Github repo
Now I will commit these changes to the master branch to Github

on github, create a new branch

then pull to local repo and view in Github desktop
/Users/jimmason/Documents/Github/ebc-api

>> git commit --dry-run -m 'fix trade accounting jim'

On branch dev

Your branch is up to date with 'origin/dev'.

Changes not staged for commit:

  (use "git add <file>..." to update what will be committed)

  (use "git restore <file>..." to discard changes in working directory)

 modified:   src/services/offers/offers.hooks.js

 modified:   src/services/trades/trades.hooks.js

no changes added to commit (use "git add" and/or "git commit -a")
Select a file in Explorer > select timeline << versions listed
Select another version > compare << comparison window opens showing changes between the 2 versions
Select RB menu << menu options include: stage selected ranges, unstage selected ranges, revert selected ranges

https://code.visualstudio.com/docs/nodejs/nodejs-tutorial
nodejs-tutorial-code.visualstudio-Nodejs tutorial in Visual Studio Code.pdf
Note: If you've been using the VS Code integrated terminal to install the Express generator and scaffold the app, you can open the myExpressApp folder from your running VS Code instance with the File > Open Folder command.
VS Code uses TypeScript type declaration (typings) files (for example node.d.ts) to provide metadata to VS Code about the JavaScript based frameworks you are consuming in your application. Type declaration files are written in TypeScript so they can express the data types of parameters and functions, allowing VS Code to provide a rich IntelliSense experience. Thanks to a feature called Automatic Type Acquisition, you do not have to worry about downloading these type declaration files, VS Code will install them automatically for you.
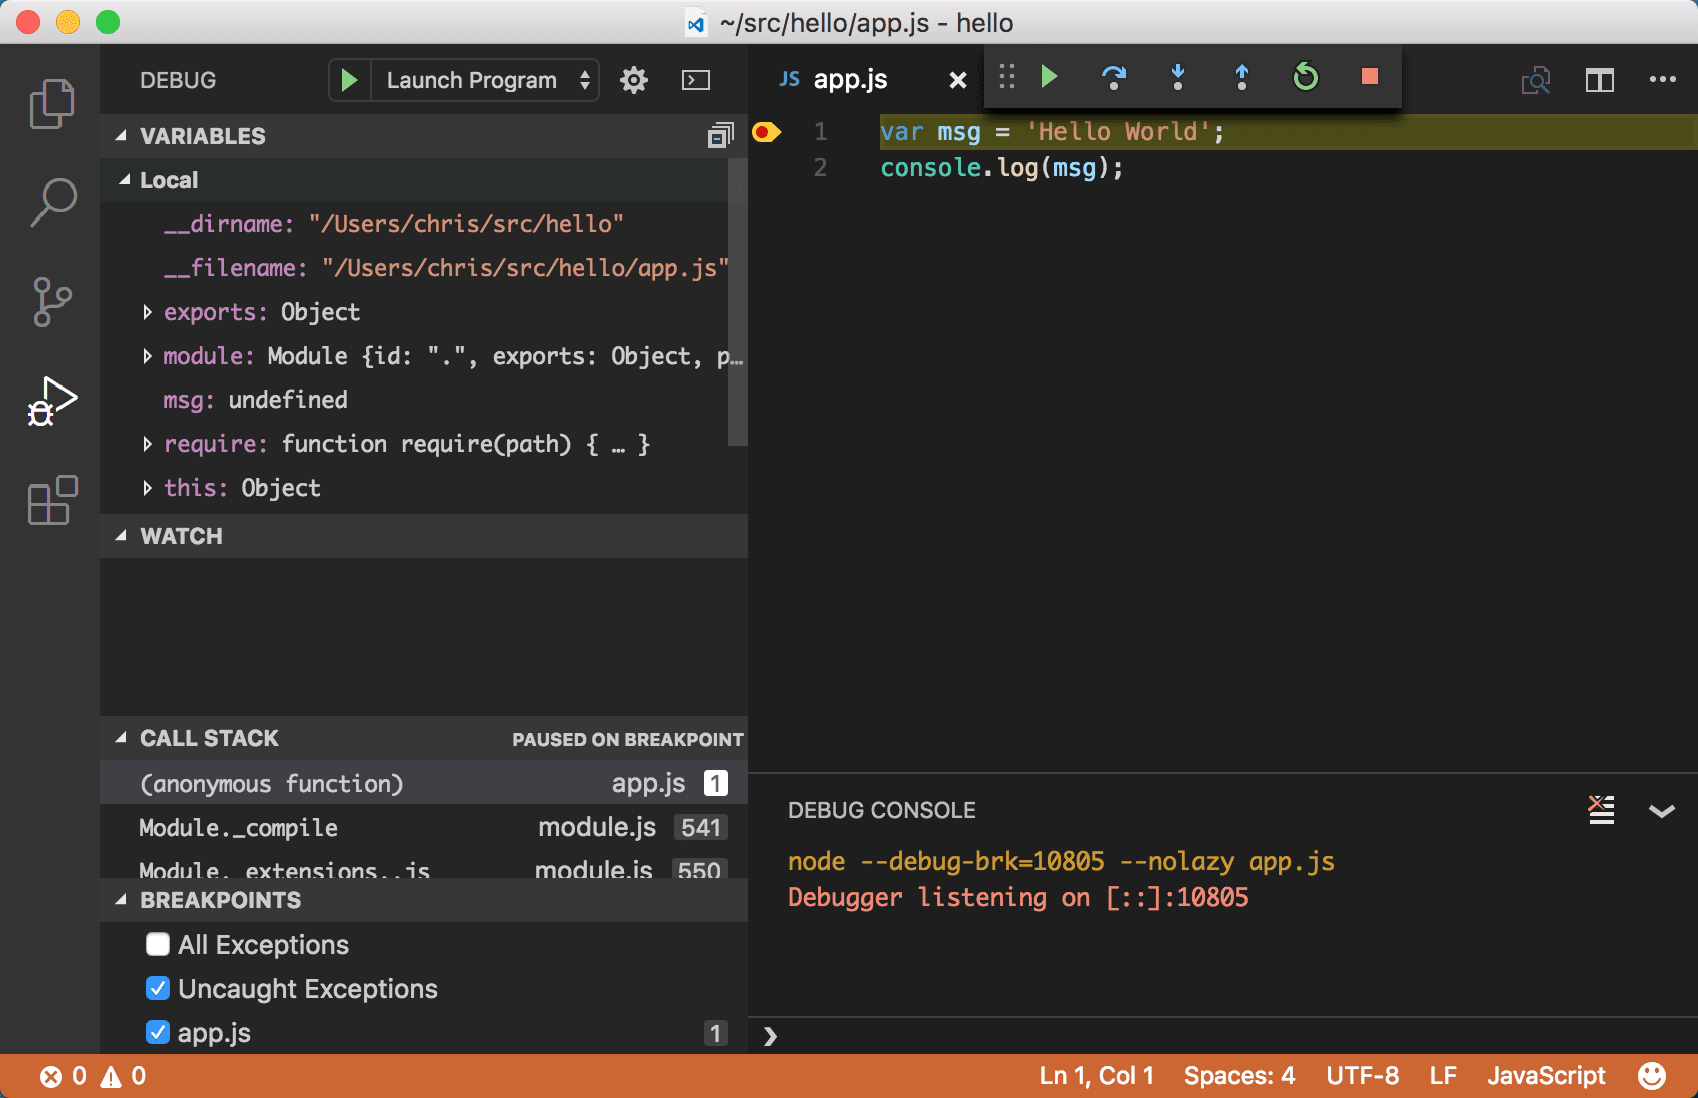
The debug and terminal views can be opened from the View menus
https://code.visualstudio.com/docs/nodejs/nodejs-debugging
The Visual Studio Code editor has built-in debugging support for the Node.js runtime and can debug JavaScript, TypeScript, and many other languages that are transpiled into JavaScript. Setting up a project for Node.js debugging is straightforward with VS Code providing appropriate launch configuration defaults and snippets.
There are a few ways you can debug your Node.js programs in VS Code:
If the Auto Attach feature is enabled, the Node debugger automatically attaches to certain Node.js processes that have been launched from VS Code's Integrated Terminal. To enable the feature, either use the Toggle Auto Attach command from the command palette (F1) or, if it's already activated, use the Auto Attach Status bar item.
There are three modes for auto attach, which you can select in the resulting Quick Pick and via the debug.javascript.autoAttachFilter setting:
smart (default) - If you execute a script outside of your node_modules folder or use a common 'runner' script like mocha or ts-node, the process will be debugged. You can configure the 'runner' script allow list using the Auto Attach Smart Pattern setting (debug.javascript.autoAttachSmartPattern).always - All Node.js processes launched in the Integrated Terminal will be debugged.onlyWithFlag - Only processes launched with the --inspect or --inspect-brk flag will be debugged.After enabling Auto Attach, you'll need to restart your terminal. This can be done by clicking the ⚠ icon in the top right of the terminal, or just creating a new one. Then, the debugger should attach to your program within a second:
When auto attach is on, the Auto Attach item will appear in the status bar across the bottom of the VS Code window. Clicking it allows you to change the auto attach mode, or temporarily turn it off. Temporarily turning off auto attach is useful if you're running some one-off programs where you don't need debugging, but you don't want to disable the feature entirely.
Other Launch Configuration Properties
You can apply other properties normally found in launch.json to auto attach in the debug.javascript.terminalOptions setting. For example, to add node internals to your skipFiles, you could add the following to your user or workspace settings:
  "debug.javascript.terminalOptions": {
    "skipFiles": [
      "<node_internals>/**"
    ]
  },
Auto Attach Smart Patterns
In smart Auto Attach mode, VS Code will try to attach to your code, and not attach to build tools you aren't interested in debugging. It does this by matching the main script against a list of glob patterns. The glob patterns are configurable in the debug.javascript.autoAttachSmartPattern setting, which defaults to:
[
  '!**/node_modules/**', // exclude scripts in node_modules folders
  '**/$KNOWN_TOOLS$/**' // but include some common tools
];
$KNOWN_TOOLS$ is replaced list a list of common 'code runners' such as ts-node, mocha, ava, and so on. You can modify this list if these settings don't work. For example, to exclude mocha and include my-cool-test-runner, you could add two lines:
[
  '!**/node_modules/**',
  '**/$KNOWN_TOOLS$/**',
  '!**/node_modules/mocha/**', // use "!" to exclude all scripts in "mocha" node modules
  '**/node_modules/my-cool-test-runner/**' // include scripts in the custom test runner
];
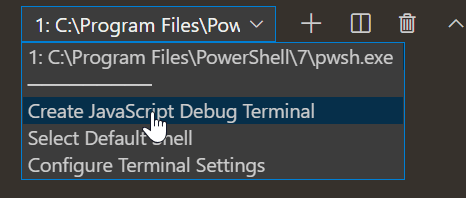
In a similar way to auto attach, the JavaScript Debug Terminal will automatically debug any Node.js process you run in it. You can create a Debug Terminal by running the use the Debug: Create JavaScript Debug Terminal command from the command palette (F1), or by selecting the Create JavaScript Debug Terminal from the terminal switcher dropdown.
Other Launch Configuration Properties
You can apply other properties normally found in launch.json to the debug terminal in the debug.javascript.terminalOptions setting. For example, to add node internals to your skipFiles, you could add the following to your user or workspace settings:
"debug.javascript.terminalOptions": {
  "skipFiles": [
    "<node_internals>/**"
  ]
},
Launch configs are the traditional way to set up debugging in VS Code, and provide you the most configuration options for running complex applications.
In this section we'll go into more detail about configurations and features for more advanced debugging scenarios. You'll find instruction for debugging with source maps, stepping over external code, doing remote debugging, and much more.
If you'd like to watch an introductory video, see Getting started with Node.js debugging.
Note: If you are just getting started with VS Code, you can learn about general debugging features and creating
launch.jsonconfiguration files in the Debugging topic.
Debugging configurations are stored in a launch.json file located in your workspace's .vscode folder. An introduction into the creation and use of debugging configuration files is in the general Debugging article.
Below is a reference of common launch.json attributes specific to the Node.js debugger. You can view the complete set of options in the vscode-js-debug options documentation.
The following attributes are supported in launch configurations of type launch and attach:
outFiles - array of glob patterns for locating generated JavaScript files. See section Source maps.resolveSourceMapLocations - an array of glob patterns for locations where source maps should be parsed. See section Source maps.timeout - when restarting a session, give up after this number of milliseconds. See section Attaching to Node.js.stopOnEntry - break immediately when the program launches.localRoot - VS Code's root directory. See section Remote debugging below.remoteRoot - Node's root directory. See section Remote debugging below.smartStep- try to automatically step over code that doesn't map to source files. See section Smart stepping.skipFiles - automatically skip files covered by these glob patterns. See section Skipping uninteresting code.trace - enable diagnostic output.These attributes are only available for launch configurations of request type launch:
program - an absolute path to the Node.js program to debug.args - arguments passed to the program to debug. This attribute is of type array and expects individual arguments as array elements.cwd - launch the program to debug in this directory.runtimeExecutable - absolute path to the runtime executable to be used. Default is node. See section Launch configuration support for 'npm' and other tools.runtimeArgs - optional arguments passed to the runtime executable.runtimeVersion - if "nvm" (or "nvm-windows") or "nvs" is used for managing Node.js versions, this attribute can be used to select a specific version of Node.js. See section Multi version support below.env - optional environment variables. This attribute expects environment variables as a list of string typed key/value pairs.envFile - optional path to a file containing environment variable definitions. See section Load environment variables from external file below.console - the console to launch the program (internalConsole, integratedTerminal, externalTerminal). See section Node Console below.outputCapture - if set to std, output from the process stdout/stderr will be shown in the Debug Console, instead of listening to output over the debug port. This is useful for programs or log libraries that write directly to the stdout/stderr streams instead of using console.* APIs.This attribute is only available for launch configurations of request type attach:
restart - restart the connection on termination. See section Restarting debug session automatically.protocol - debug protocol to use. See section Supported Node-like runtimes above.port - debug port to use. See sections Attaching to Node.js and Remote debugging.address - TCP/IP address of the debug port. See sections Attaching to Node.js and Remote debugging.processId - the debugger tries to attach to this process after having sent a USR1 signal. With this setting, the debugger can attach to an already running process that was not started in debug mode. When using the processId attribute, the debug port is determined automatically based on the Node.js version (and the used protocol) and cannot be configured explicitly. So don't specify a port attribute.continueOnAttach - whether to continue the process if it's paused when we attach to it. This option is useful if you launch your program with --inspect-brk.You can trigger IntelliSense (⌃Space) in your launch.json file to see launch configuration snippets for commonly used Node.js debugging scenarios.
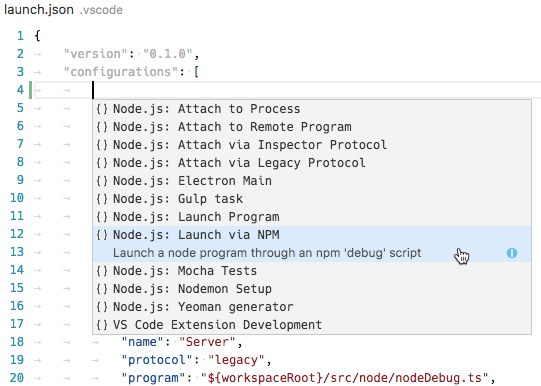
You can also bring up the snippets with the Add Configuration... button in the lower right of the launch.json editor window.
__tech-debug-feathers-vscode.mp4
-tech-debug-feathers-vscode-audio-only-m4a-b6906941-4f0bt.docx
VS Code Live: Agent Mode Day and see how VS Code is redefined with AI. You'll learn about all the latest updates, hearing directly from members of the VS Code and GitHub teams. With live demos on agent mode, MCP servers, Bring Your Own Key, and more, you won't want to miss this!
Agenda:
Keynote - MCP: The Protocol Behind the Curtain
Agent mode
Project Padawn
Using & Building MCP servers
BYOK
Notebooks
Copilot Next Edit Suggestions (NES)
Completions model
Customizing Copilot
Live coding with Wes Bos
<< Does not cover Linux apps - see VSCode >>
https://www.azuredevopslabs.com/labs/vstsextend/appcenter/
Before you begin
You must have the following -
App Center account - Sign up with App Center for free
API Token with Full Access to the App Center
Personal Access Token (PAT) for GitHub with repo scope
business context and value opportunities
Add the steps involved:
| You may also want to use visual panels to communicate related information, tips or things users need to be aware of. |
sample code block
given the analysis above are there any recommended next steps for DMX team members?
Related articles appear here based on the labels you select. Click to edit the macro and add or change labels.
|