m Windows apps
- jim mason
Key Points
- set a default file type handler program
References
Key Concepts
HP Printer software installed on Windows
install HP Print and Scan software for Windows 10 first ( see below )
see the HP printer options installed below for the HP 9015 printer ..
.png?version=1&modificationDate=1569855393962&cacheVersion=1&api=v2&width=711&height=400)
Install HP Print and Scan software on Windows 10
Apps and Tools
-------------------------------
epub2pdf converters
ebook converter does the best conversion job so far ...
C:\Users\Jim Mason\Documents\Auexsoft\Ebook Converter\New Files
doxillon pdf converter not as good - poor fonts, spacing, size
Avoid any epub books that are purchased.
The files aren't downloadable so they can't be converted to pdf
SharePoint CMS
Teams CMS App
teams notes from
Excel project templates
https://spreadsheeto.com/project-management-templates/ |
https://www.vertex42.com/ExcelTemplates/excel-project-management.html |
Project Gantt Template
https://www.vertex42.com/ExcelTemplates/excel-gantt-chart.html
This template contains the core functionality needed to create a simple Gantt chart easily. Each row of the worksheet represents a separate task. All you need to do is define the start date and duration of each task.
- To add more tasks, you just copy and paste rows (or insert a row then press Ctrl+D to copy formulas down).
- To change the range of dates displayed in the chart area, just slide the scroll bar.
- To track the status of a task, edit the % Complete column. The bars in the chart show the % complete for each task.
- The vertical red line shows the current date.
- To use the automatic work breakdown structure numbering, copy the formula for the appropriate level from the bottom of the worksheet.
- Update 2/12/2018: The most significant update to the free version in many years: it is now unlocked!
While planning a project, you may also want to use a yearly calendar or project budget worksheet
Project Task List Templates
https://www.vertex42.com/ExcelTemplates/task-list-template.html
project-task-list-template.xlsx
- Project Task List
- Simple Task Tracker
- Task List with Gantt Chart
- Task Checklist Template
- Printable Task List Templates
Project Timeline Chart Template
https://www.vertex42.com/ExcelTemplates/project-timeline.html
project-timeline-data-chart.xlsx
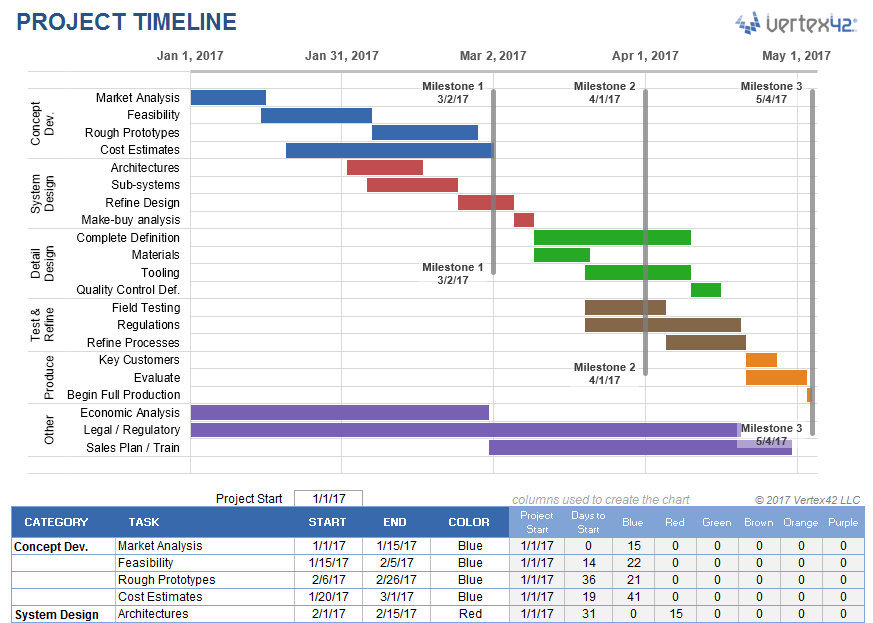
A project timeline can be created in Excel using charts linked to data tables, so that the chart updates when you edit the data table. The first template on this page uses a stacked bar chart technique and also includes up to 4 milestones as vertical lines. This template is a cross between my project schedule and task list templates. I've populated the template with some generic product development terminology, but it is designed for you to enter your own tasks and dates. The second template uses a scatter chart with data labels and leader lines to create a more traditional type of timeline.
Using the Project Timeline workbook
Grouping Tasks Using Different Colors: One of the key features of this template is the ability to choose a different color for the bars in the timeline via a drop-down box in the Color column. This makes it easy to identify the different phases or categories of tasks. You can insert and delete tasks by just inserting or deleting rows in the spreadsheet's data table.
The example above shows some of the steps in a product development cycle (Concept Development, System Design, Detail Design, Testing and Refining, Production, etc.), with different colors representing different phases of the cycle. However, there are other ways to use this type of timeline. Another common way to group tasks within a project timeline is by key organization function, such as Marketing, Design, Testing, Manufacturing, Finance, Sales, Quality Assurance, Legal, etc.
Milestones: With any project timeline, you will most likely want to define at least a couple key milestones. In the above example you will see 3 milestones as vertical lines. You can edit the milestone labels and dates via the data table. The template lets you show up to 4 milestones. Adding more is possible but would require you to create the new data series yourself (you can't just insert rows for more milestones like you can with the tasks).
Can I Add More Colors? This project timeline is set up to allow up to 6 different color choices. Adding more colors is possible, but that would require more Excel experience. Some general steps to follow to attempt adding more colors:
- Add a new column to the right of the current data table.
- Copy the formulas in the previous column into the new column.
- Select the timeline and drag the range marker to the right to include the new column.
- Add some data to see what color the new column uses and then update the column label.
- Update the list used for the data validation drop-down box in the Color column to include the new label.
Dates Not Changing in the Chart? To edit the range of dates shown in the chart, you need to edit the Minimum and Maximum bounds of the horizontal axis. Right-click on the axis and select Format Axis.
Want More Flexibility / Ease of Use? If you don't care about automation and just want a simple way to create a high-level project timeline, you might want to try the Project Schedule Template. Colors are modified by just changing the background colors of the cells in the spreadsheet.
Project Timeline Data Chart
https://www.vertex42.com/ExcelTemplates/project-timeline.html
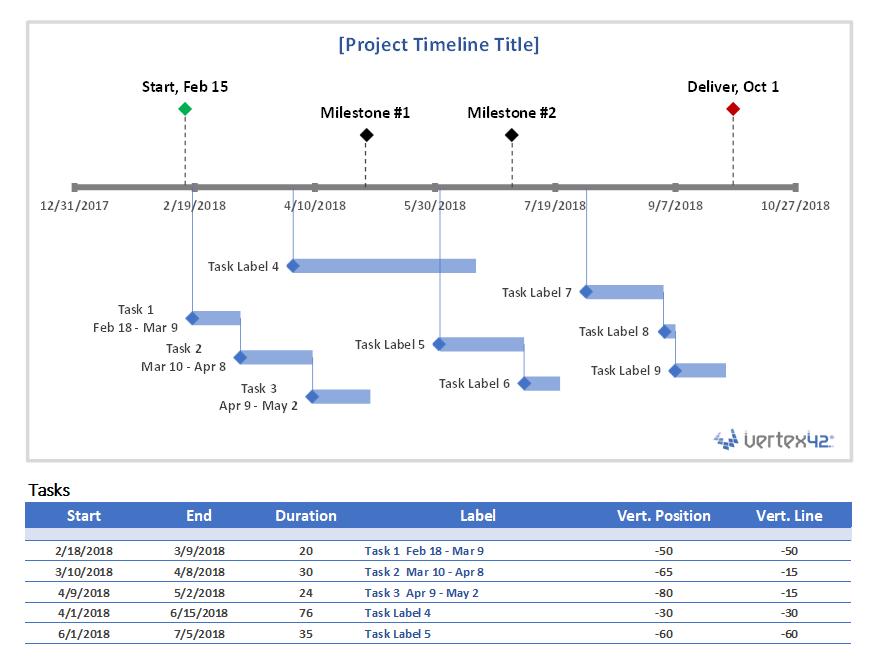
This project timeline uses two different scatter chart series to display milestones above the timeline and tasks with durations below the timeline. The durations are created using X Error bars. The length of the leaderlines for the tasks can be defined by the user to show task dependencies.
The vertical positions of the tasks and milestones are adjusted by the user. This may work great for some timelines, but if you have more than 20 tasks to show, you may be better of using a Gantt Chart.
This template is based on the original Vertex42 Excel Timeline Template, which was one of the first timeline templates developed for Excel using the technique of leaderlines and error bars for durations. This new project timeline works only in the more recent versions of Excel (2013 or later) because of the new feature in Excel that allows you to specify a range of cells for Data Labels.
To learn how to create a timeline using a scatter chart, see the video demos for the Bubble Chart Timeline and Vertical Timeline templates.
Use a Graphic as a Data Point Marker in a Project Timeline
You can add graphics to a project timeline to make it more interesting or visually appealing. For example, you may want to mark the final milestone with a finish-line flag, as shown in the image below. To do this, you will first need to create a graphic using your favorite image editing app, or download one. The diamond ![]() and flag
and flag ![]() that I use in my project timelines were created from screenshots of common unicode characters.
that I use in my project timelines were created from screenshots of common unicode characters.
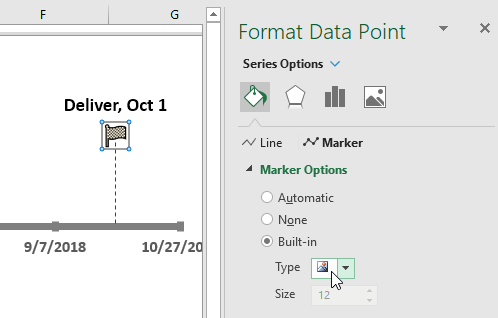
Steps for using a graphic as a data point marker:
- Select a single data point by clicking on it and then clicking on it again.
- Right-click on the selected data point to open the Format Data Point task pane.
- Click on the Bucket > Marker > Marker Options > Built-in, then select the picture icon from the Type drop-down.
- Select the image from your computer.
Potential Value Opportunities
Potential Challenges
Candidate Solutions
Step-by-step guide for Example
sample code block