m Microsoft Analytics
- jim mason
Key Points
- is data, ML, AI integrated and adding value into the business and consumer processes and decisions?
- who is served by the analytics? the company or the customer?
- is the analysis pre-defined or created at runtime with new data?
- is the purpose to provide data to a user?
- is the purpose to generate a forecast from a VA - virtual assistant?
- does the forecast account for risk tolerances?
- are the risks and forecasts adjusted from experience? using a beta?
- can the user set a risk preference for the forecasts?
- does the forecast compare multiple model accuracy over time?
- more
Microsoft Data Analytics Products
- PowerBI is free for individual user
- PowerBI can run embedded on a server
- R server is free from Microsoft
- SSIS is their primary platform
References
Power BI licenses- 2020 pricing
Power BI comes in three levels – Desktop, Pro, and Premium. The Desktop level is free for individual users, while the Pro plan costs $9.99 per user per month. The Premium plan starts at $4,995 a month per dedicated cloud compute and storage resource
No matter which option you choose, to share your content you need a Power BI Pro license, or the content needs to be in a Premium capacity. License requirements vary for the colleagues who view your content, depending on the option you choose. The following sections spell out details.
Test Setups
mysqld connection
localhost:3306
root2
D:\bsave\data\mysql\jem-msysql1.sql
Key Concepts
Power BI Product Set
https://powerbi.microsoft.com/en-us/
Power BI
Unify data from many sources to create interactive, immersive dashboards and reports that provide actionable insights and drive business results.
Power Apps
Build apps in hours—not months—that easily connect to data, use Excel-like expressions to add logic, and run on the web, iOS, and Android devices.
Power Automate
Include powerful workflow automation directly in your apps with a no-code approach that connects to hundreds of popular apps and services.
Power Virtual Agents
Create conversational experiences that offer support by easily building and maintaining virtual agents—no coding required.
Power BI Desktop - free download
https://powerbi.microsoft.com/en-us/get-started/
Power BI Demos
https://powerbi.microsoft.com/en-us/demo/
Power BI Sample Data sets
https://docs.microsoft.com/en-us/power-bi/sample-datasets#the-power-bi-samples-as-pbix-files
Power BI Services Concepts
https://docs.microsoft.com/en-us/power-bi/service-basic-concepts
The five major building blocks of Power BI are: dashboards, reports, workbooks, datasets, and dataflows. They're all organized into workspaces, and they're created on capacities. It's important to understand capacities and workspaces before we dig into the five building blocks, so let's start there.
Capacities = Azure Services - Public or Private
Capacities are a core Power BI concept representing a set of resources (storage, processor, and memory) used to host and deliver your Power BI content. Capacities are either shared or dedicated. A shared capacity is shared with other Microsoft customers, while a dedicated capacity is fully committed to a single customer. Dedicated capacities require a subscription, and are fully described in the Managing Premium capacities article.
Shared capacity constraints
By default, workspaces are created on a shared capacity. In shared capacity, workloads run on computational resources shared with other customers. As the capacity must share resources, limitations are imposed to ensure "fair play", such as the maximum model size (1 GB) and maximum daily refresh frequency (eight times per day).
Workspaces - containers in environments - My Workspace and other workpaces
Workspaces are created on capacities. Essentially, they are containers for dashboards, reports, workbooks, datasets, and dataflows in Power BI.
There are two types of workspaces: My workspace and workspaces.
My workspace is the personal workspace for any Power BI customer to work with your own content. Only you have access to your My workspace. You can share dashboards and reports from your My Workspace. If you want to collaborate on dashboards and reports, or create an app, then you want to work in a workspace.
Workspaces are used to collaborate and share content with colleagues. You can add colleagues to your workspaces and collaborate on dashboards, reports, workbooks, and datasets. With one exception, all workspace members need Power BI Pro licenses. Read more about the new workspaces.
Workspaces are also the places where you create, publish, and manage apps for your organization. Think of workspaces as staging areas and containers for the content that will make up a Power BI app. So what is an app? It's a collection of dashboards and reports built to deliver key metrics to the Power BI consumers in your organization. Apps are interactive, but consumers can't edit them. App consumers, the colleagues who have access to the apps, don't necessarily need Pro licenses.
Options to share a dashboard
https://docs.microsoft.com/en-us/power-bi/service-how-to-collaborate-distribute-dashboards-reports
- If colleagues need to keep the dashboard up to date, or need access to all the content in the workspace, consider adding them to the workspace.
- If colleagues just need to see that dashboard and not all the content in the workspace, you again have alternatives. If a few people need just that one dashboard, then sharing the dashboard could be the best solution.
- However, if the dashboard is part of a bigger set of content you need to distribute to many colleagues, then publishing an app is likely the best choice.
Data flows - optional - manage complex data integrations
A dataflow helps organizations to unify data from disparate sources. They are optional, and are often used in complex or larger projects. They represent data prepared and staged for use by datasets.
Use connectors to ingest data.
Data flows stored as entities in the Common Data Model (CDM) in Azure Data Lake Storage Gen2
They're scheduled to refresh on a recurring basis to store up-to-date data. They're great for preparing data for use—and potential re-use—by your datasets.
Data Sets - provide the data for reports
A dataset is a collection of data that you import or connect to.
Datasets can also source data from dataflows
Datasets are associated with workspaces and a single dataset can be part of many workspaces
Each listed dataset represents a single source of data
Data connections support include: dataset types that you can use with Power BI.
Datasets added by one workspace member are available to the other workspace members with an admin, member, or contributor role.
Datasets can be refreshed, renamed, explored, and removed. Use a dataset to create a report from scratch or by running quick insights. To see which reports and dashboards are already using a dataset, select View related. To explore a dataset, select it. What you're actually doing is opening the dataset in the report editor where you can really start exploring into the data by creating visualizations.
Reports - created from data sets
A Power BI report is one or more pages of visualizations such as line charts, maps, and treemaps. Visualizations are also called visuals. All of the visualizations in a report come from a single dataset. You can create reports from scratch within Power BI, import them with dashboards that colleagues share with you, or Power BI can create them when you connect to datasets from Excel, Power BI Desktop, databases, and SaaS applications. For example, when you connect to an Excel workbook that contains Power View sheets, Power BI creates a report based on those sheets. And when you connect to an SaaS application, Power BI imports a pre-built report.
Read or Edit mode
There are two modes to view and interact with reports: Reading view and Editing view. When you open a report, it opens in Reading view. If you have edit permissions, then you see Edit report in the upper-left corner, and you can view the report in Editing view. If a report is in a workspace, everyone with an admin, member, or contributor role can edit it.
Each listed report represents one or more pages of visualizations based on only one of the underlying datasets
Report Flexibility
is contained in a single workspace.
can be associated with multiple dashboards within that workspace. Tiles pinned from that one report can appear on multiple dashboards.
can be created using data from one dataset. Power BI Desktop can combine more than one data source into a single dataset in a report, and that report can be imported into Power BI.
Dashboards - contain 1 or more report tiles
A dashboard is something you create in the Power BI service or something a colleague creates in the Power BI service and shares with you. It is a single canvas that contains zero or more tiles and widgets.
There are many ways to add tiles to your dashboard; too many to be covered in this overview topic. To learn more, see Dashboard tiles in Power BI.
There are many different ways that you, or a colleague, can share a dashboard. Power BI Pro is required for sharing a dashboard and may be required for viewing a shared dashboard.
ONE dashboard...
is associated with a single workspace
can display visualizations from many different datasets
can display visualizations from many different reports
can display visualizations pinned from other tools (for example, Excel)

Workbooks - some data sets may be set as workbooks that are editable in dashboard
When you use Get data with Excel files, you have the option to Import or Connect to the file. When you choose Connect, your workbook will appear in Power BI just like it would in Excel Online. But, unlike Excel Online, you’ll have some great features to help you pin elements from your worksheets right to your dashboards.
You can’t edit your workbook in Power BI. But if you need to make some changes, you can click Edit, and then choose to edit your workbook in Excel Online or open it in Excel on your computer. Any changes you make are saved to the workbook on OneDrive.
Ways to Share Work in Power BI
https://docs.microsoft.com/en-us/power-bi/service-how-to-collaborate-distribute-dashboards-reports
Power BI - Ex 1 - Product Sales by Rep
Data Set Tab
Create Data Set in the workspace
Connect to a data source or data flow
If needed, edit the data model
Add a column
- added month number from the date ( issue> - no monthName function - want to sort by number, use name label )
Add a quick measure
Reports Tab
Columns - Visualization Workspace, Selected Data, Filters List, Visualizations List, Data Tables List
Select a Visualization template
( issue> how to redisplay the Data Tables List after expanding focus mode on the Visualization space ?? )
issue: how to add a data set to a visualization template?
>> if data table shown in visualization panel, select table to allow edits to table fields on the report
Manage relationships - explicitly or auto-detect
Drill Through Edit Access
>> select the drill through section at the bottom of a table edit, drill through menus become active
Power BI Getting Started Tutorial
https://docs.microsoft.com/en-us/power-bi/desktop-getting-started
Other Comparisons
SWT EBI Alternative using BIRT, AWS
Create distributable and viewable reports and report notebooks with optional filters and drill downs to detail data reports
Can run reports from Eclipse or embed in Web applications as services
Can export report data or report visualizations
Run BI containers with BIRT, Tomcat, Groovy, Grails, SWT workspaces, local data sources, optional added features
Connectivity to remote data sources, targets can be configured
Streams and events delivered by Kafka
Containers can be managed by Kubernetes
TLS data services
Monitored spaces that can be upgraded or downgraded with 60 days notice
Notices when near monthly capacity
Use cases
Consolidated enterprise reporting
Web dashboards
IoT integrations
Blockchain networks
Priced components Monthly
AWS Lightsail 32gb / 8 core / 640gb / 7 TB = $160 / mo ... each additional TB = $100 / mo
SWT BI services = $240 / mo
Included application templates in the instance:
Lightsail offers a range of operating system and application templates that are automatically installed when you create a new Lightsail instance. Application templates include WordPress, Drupal, Joomla!, Ghost, Magento, Redmine, LAMP, Nginx (LEMP), MEAN, Node.js, Django, and more.
You can install additional software on your instances by using the in-browser SSH or your own SSH client.
Development Environment
BIRT in Eclipse
Grails
Groovy
SWT container
SWT tool set
Runtime Environment
Docker
Limitations vs Power BI
no visual option for data flow like Power BI or Google - need SQL services
some limitations on connectors - need JDBC connections ( Power BI lacks JDBC support though )
Reports allow limited interactions ( filters, sorts, exports etc ) vs Power BI which offers fine-grained visual interactions
Compare Power BI to RStudio or Cloudera Workbench
RStudio allows mixing visualizations and markdown on a report
Compare Power BI to Tableau
A quick took of Tableau
With intuitive business intelligence tools, Tableau leverages data discovery and its interpretation for any type of business user. Being user-friendly, any user can easily perform reading or writing stored information and analyze key data, while creating visualizations and innovative reports, sharing insights throughout the enterprise. Tableau is good at connecting to any data source with a drag-and-drop interface that is easy-to-use and makes transferring data simple. However, it is weak at integrating different data sources for analysis.
A quick took of Power BI
Power BI, a cloud BI, and the analytic tool provide a brief summary of your critical data and connect to your every data source. It makes simple data evaluation, sharing scalable dashboards, embedded visuals, interactive reports and more. It is good at importing simple visuals with easy-to-use and familiar interface like Excel. Power BI is simple for using that provides a full overview of your business performance and correlates heterogeneous data.
Two Key capability differences
Tableau and Power BI differs in two key capabilities in their tools in the form of visualization and data discovery depth. In the case of visualization, both tools offer different approaches. While Tableau strongly focuses on visuals, Power BI offers features of data manipulation first and provides simple visualizations later. Uploading data is easy in Power BI, and selecting different blueprint visualizations, a user can drag the data and drop in the visualization through a sidebar. Tableau offers connections to any number of heterogeneous data sources, and larger data sets visualizations, a feature unavailable in Power BI. Tableau’s dashboard provides data basics of the user that can analyze data sets deeply with a downloadable worksheet to apply different visualizations. Power BI offers visualizations first and then data dragging into it later. Reversely, Tableau provides data selection first and switching data between the visualizations later. Toggling data in Tableau between visualizations is much easier.
While Tableau offers more depth of data analysis front-end, Power BI does it more on the back-end. Users can get answers to their questions simultaneously while analyzing data visualizations in Tableau. It also shows predictions to ‘what-if’ analysis hypothetically adjusting data to visualize data comparisons dynamically. On the other hand, Power BI generates more analyses than possible with Excel to generate faster analyses of a data set. Power BI provides rich functionality like making correlations between different data sources. Tableau offers more visualization flexibility, but unable to manipulate data as good as Power BI that also analyses data where Excel fails, a feature unavailable in Tableau.
Other key differences
Tableau can be a better option when data visualization is the need of the hour for business analytics. However, Power BI can do much better with predictive modeling, reporting, and optimization when a broad analytics needed. Though Tableau is the best BI tool in the market yet, Power Bi is a better option from the perspective of a business. Microsoft’s uninterrupted efforts to improve Power BI tool leveraged its quality and competitiveness in the market with a strong-growing community for it. Power BI enjoys the advantages of Microsoft business analytics that includes platforms such as Azure Machine learning, SQL Server based Analysis Services, data streaming in real time, and many Azure databases offers. It is difficult for Tableau to compete with this.
Power BI is unable to answer questions as does by Tableau. One significant aspect of Tableau is its R analytic language integration that gives powers to programmers and advanced users to create any analysis forms into Tableau, in particular, predictive analytics and statistical analytics. With the addition of cloud Power BI for charts and dashboard sharing, and combining with Desktop Power BI offering a tool for data visualization, Power BI has come a long way to become a full-fledged BI tool. Desktop Power BI offers all functionalities bundled in Power View, Power Query and Power Pivot, and Cortana-driven language speech capability of the Q&A-based interface. The Power BI can connect to SQL server based analytics, and Azure based stream analytics for creating real-time dashboards. Power BI also offers Microsoft’s Revolution analytics with R programming language for open-source analytics for enterprises.
Conclusions
Simply speaking, no comparison is feasible between Tableau and Power feature by feature. With the self-containing environment, Power BI offers more of Microsoft architecture related features, a significant advantage, whereas Tableau’s advantage lies in self-containing data visualization and its advanced capabilities, and scalability. If the data visualization is your choice for your business analytics, Tableau becomes your first choice. The Power BI is a better choice for predictive modeling, reporting, and optimization offering with splendid serviceability at a much lower cost of ownership. It can also be cost-effective if Office 365 is already in use. Budget wise it is much lower than Tableau
Power BI competes with Tableau aggressively in many ways with its noteworthy features such as integration with Office 365 suite, Excel, and share point, and selective sharing with targeted users only. The desktop version of Power BI covers equal data sources as covered by Tableau, and ability to use Machine Learning to analyze particular data sets in the on-line version of Power BI. In data modeling, it offers the infinite option and several features that need advanced knowledge. Power BI also offers custom visuals not limited to a number of the default visualizations, Dax expressions similar to Excel but much more advanced to create fields for calculations. With all such offerings, many small-to-medium size enterprises opting Power BI as it is cost effective for them. Comparatively, Tableau is costlier.
Tableau offers connectivity to a wide range of heterogeneous data sources, but still weak in integrating and combining them for analysis. Power Bi, still in development stage, is unable to offer publishing associated data reports leaving some information out from visualization. Some customers feel Power BI lacks features and initiatives critical to needs that are not sufficient. All said and done, neither product is perfect, their purposes are different, not comparable on many fronts.
However, Tableau is a better solution in comparison, though Power BI narrows the gap with significant Microsoft advancement and updates in enhancements. Tableau is still popular and more complete BI tool, while Power BI offers a good alternative with many comparable features, though not comparable feature by feature with Tableau.
Whatever be the choice between Tableau and Power BI, need balancing cost aspect with functionalities required, potentials of benefits for the business, and anticipated adoption when judging the two. Rather focussing solely on price consideration, consider incremental pricing if the size of deployment grows as also maintenance cost over the time. Also, look at the option of cloud BI to take advantage of reducing the cost for infrastructure and product innovations, with no need to upgrading the existing infrastructure. Trying both the solutions is the best way to see the differences firsthand.
Business Analytics Book topics
The knowledge areas of BABOK Guide are:
- Business Analysis Planning and Monitoring: describes the tasks used to organize and coordinate business analysis efforts.
- Elicitation and Collaboration: describes the tasks used to prepare for and conduct elicitation activities and confirm the results.
- Requirements Life Cycle Management: the tasks used to manage and maintain requirements and design information from inception to retirement.
- Strategy Analysis: describes the tasks used to identify the business need, address that need, and align the change strategy within the enterprise.
- Requirements Analysis and Design Definition: describes the tasks used to organize requirements, specify and model requirements and designs, validate and verify information, identify solution options, and estimate the potential value that could be realized.
- Solution Evaluation: describes the tasks used to assess the performance of and value delivered by a solution and to recommend improvements on increasing values.
Learning R roadmap
DataCamp Data Scientist with R Track program - 22 courses
Learning Python roadmap
Data Type Categories
https://www.mymarketresearchmethods.com/types-of-data-nominal-ordinal-interval-ratio/
Nominal = Labels ( registered, not registered etc )
Nominal scales are used for labeling variables, without any quantitative value. “Nominal” scales could simply be called “labels.” Here are some examples, below
Ordinal data ( eg satisfaction - High, Medium, Low )
Ordinal scales are typically measures of non-numeric concepts like satisfaction, happiness, discomfort, etc.
Numerical data ( continuous range of values from M to N )
Advanced note: The best way to determine central tendency on a set of ordinal data is to use the mode or median; a purist will tell you that the mean cannot be defined from an ordinal set.
Interval data ( numerical data with fixed ranges - eg weather is in the 60's or the 80's )
Interval scales are numeric scales in which we know both the order and the exact differences between the values. The classic example of an interval scale is Celsius temperature because the difference between each value is the same. For example, the difference between 60 and 50 degrees is a measurable 10 degrees, as is the difference between 80 and 70 degrees.
relative to a center point etc but doesn't define a zero value necessarily ( like numeric data )
Ratio data ( eg weight, age etc )
Ratio scales are the ultimate nirvana when it comes to data measurement scales because they tell us about the order, they tell us the exact value between units, AND they also have an absolute zero–which allows for a wide range of both descriptive and inferential statistics to be applied. At the risk of repeating myself, everything above about interval data applies to ratio scales, plus ratio scales have a clear definition of zero. Good examples of ratio variables include height, weight, and duration.
Categorical data ( eg satisfaction - High, Medium, Low )
Data Analysis Types
http://www.mymarketresearchmethods.com/descriptive-inferential-statistics-difference/
descriptive
In a nutshell, descriptive statistics intend to describe a big hunk of data with summary charts and tables, but do not attempt to draw conclusions about the population from which the sample was taken. You are simply summarizing the data you have with pretty charts and graphs–kind of like telling someone the key points of a book (executive summary) as opposed to just handing them a thick book (raw data).
inferential
Conversely, with inferential statistics, you are testing a hypothesis and drawing conclusions about a population, based on your sample. In this case, you are going to run into fancy sounding concepts like ANOVA, T-Test, Chi-Squared, confidence interval, regression, etc., but we’ll save those for another day.
Define correlations, infer casuality
Create models and hypotheses
Test data sets to train on to validate correctness
Forecasting sales ( eg Winters double exponential smoothing )
prescriptive
when a remediation is required.
Predictive maintenance on parts, When a customer account has potential sales opportunities ( cross-sell or volume increase )
Visualizations should tell a story, answer key questions, highlight key facts
Guide to Visualization Methods
https://drive.google.com/open?id=1l5jCQ_ppFNKkOX6_xJSDRSVyBjYAL7qk
how to mix data types on different chart types

Consider Live data charts
- charts can be connected to data streams and updated as data changes
- think a 911 dashboard on hot calls
.
- think a 911 dashboard on hot calls
- a 2 way chart can update the data source directly as well
- think a actual vs forecast sales chart. During review, the forecast lines for future months can be moved to a new level changing the forecast in the data source ( see ENVY/400 charts 1994 )
,
- think a actual vs forecast sales chart. During review, the forecast lines for future months can be moved to a new level changing the forecast in the data source ( see ENVY/400 charts 1994 )
- drill-down charts
- think monthly sales by division. Click on a division's month sales to drill down to a pie chart showing product lines sales for that division this month or a chart showing monthly sales by product line for just that division
Power BI Data Sources
MySQL connection from Power BI uses MS connector
Connections to MySQL from Power Query/Power BI Desktop tend to default to Windows credentials which often do not work with default installations of MySQL Server. For example, if you have a local MySQL server running and can connect to it and view data with Workbench but attempt the following procedure:
- 1. Start Power BI Desktop - Get Data - MySQL Database - Connect
- 2. In "MySQL Database" dialog enter "localhost" or name of local machine, enter name of database and press OK button.
You may see the following error in your query editor window:
"DataSource.Error: Object reference not set to an instance of an object."
You are most likely getting a "user not authorized error". To resolve this issue, go to File | Options and Settings | Data source settings and edit your data source and set the credentials to "Database credentials", not Windows credentials.
using views
Excel Power Query and Power BI Desktop query Navigator, as of the August 2015 update, do not support MySQL Views. To get data from MySQL views, use the "SQL statement (optional)" and enter a SQL query such as:
SELECT * FROM "database"."view"
Note, you must use Get Data | MySQL Database and NOT use Recent Sources, as using Recent Sources will bring up the Navigator window and not allow you to enter SQL queries directly.
detecting table relations
If running into problems detecting relationship, you can uncheck the options to automatically try to detect the data sources and import relationships from data source. To do this, go to File | Options and settings | Options
Under CURRENT FILE | Data Load | Relationships, uncheck options.
MySQL Connector issues
https://www.edureka.co/community/41704/how-to-connect-to-mysql-database-from-power-bi
Follow these steps, to connect to MYSQL database.
1. Click on Get Data.
2. Go to Database and select MYSQL.
3. Download Mysql connector "mysql-connector-net-8.0.15" and install the same.
4. Then Type your server name.
5. Type any Sql statements. (optional)
6. Select mode of authentication (window /database).
7. Select required tables and fields residing in Mysql database for creating your report and visualization.
8. Click Ok.
9. Now the data is retrieved and is ready to create visualizations
https://stackoverflow.com/questions/36444610/power-bi-not-connecting-to-mysql
Just a small tip. If you haven't already, restart the machine you just installed the connector on. I had to restart before it started working.
I'm able to connect directly to a MySQL database on port 3306. As I understand, it would be more secure to go through an SSH tunnel, but this doesn't work yet with Power BI.
So here are instructions for connecting directly:
First, let's make sure that everything besides the PowerBI connection is working.
1) Download and install the correct version of the MySQL/Net Connector. Right now, version 6.6.5 is the one that works. But from other forums, and from within PowerBI itself, I linked to other versions that did not work. (You will know it isn't working, because you probably won't be able to even open Get Data/MySQL Database/Connect.)
2) See if you can connect remotely to your database through some well established utility like MySQL workbench. If you can't, - look at ports on the remote server. Here's a cool utility to check ports&IPs: http://www.yougetsignal.com/tools/open-ports/ - Check the permissions of the DB user. Realize that they may be affiliated with an IP address: 'username'@'ipaddress'. So that user can only connect for a particular IP.
- Check the bind address setting. In newer versions of mariadb, it should probably be commented out. I'm not sure about older version and pure mysql. - other troubleshooting.
So after that's working, here are the settings which worked for me in MySQL:
go to Get Data/MySQL database/connect
Server: ipaddress:3306 (include ":port#") Database: dbname
PowerBI interface. Select "Database" instead of "Windows"
Make sure you select Database instead of Windows.
I'm able to connect directly to a MySQL database on port 3306. As I understand, it would be more secure to go through an SSH tunnel, but this doesn't work yet with Power BI.
https://stackoverflow.com/questions/36444610/power-bi-not-connecting-to-mysql
Request for JDBC Support in PowerBI
https://ideas.powerbi.com/forums/265200-power-bi-ideas/suggestions/7262643-support-jdbc-data-sources
IBM DB2 connection support for PowerBI
https://powerbi.microsoft.com/en-us/integrations/ibmdb2/
https://www.edureka.co/community/41703/how-to-connect-to-ibm-db2-database-from-power-bi
https://community.powerbi.com/t5/Power-Query/Cannot-connect-to-AS400-via-IBM-DB2-database/td-p/85646
https://www.ibm.com/support/pages/db2-odbc-cli-driver-download-and-installation-information
Steps to connect to DB2
Follow these steps, to connect to IBM DB2 database.
1. Click on Get Data.
2. Go to Database and select IBM DB2 database.
3. Then Type your server name.
4. Type any Sql statements. (optional)
5. Select mode of authentication (window /database) for first connection to data source.
6. Select required tables and fields residing in IBM DB2 database for creating your report and visualization.
7. Click Ok.
8. Now the data is retrieved and is ready to create visualizations.
Solving PowerBI AS/400 DB2 connection issue

Create Report
Connect a data source
mysql
localhost:3306
jemadm
( no jdbc option for remote db access - use BIRT instead )
Get Data from DB
Create Report
having selected a table or view for data source
select a chart type on the work area
then select fields for the chart

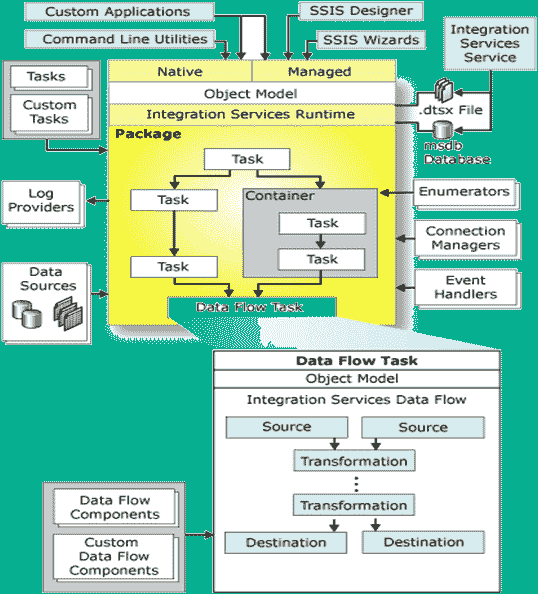
SSIS - SQL Server Information Services - SQL Server utilities
https://www.guru99.com/ssis-tutorial.html
Here, are some important SSIS features:
- Studio Environments
- Relevant data integration functions
- Effective implementation speed
- Tight integration with other Microsoft SQL family
- Data Mining Query Transformation
- Fuzzy Lookup and Grouping Transformations
- Term Extraction and Term Lookup Transformations
- Higher speed data connectivity components such as connectivity to SAP or Oracle
Potential Value Opportunities
Data Science Concepts Summary for Business Leaders
data-science-cheat-sheet-4-business-leaders-document.pdf
Potential Challenges
complexity
proprietary
portability
cost
performance
scale
pipelines
Candidate Solutions
BIRT and Grafana are 2 open-source advanced charting solutions
BIRT open-source data analytics visualizations
https://www.eclipse.org/birt/
Grafana enterprise open-source data analytics visualizations
Step-by-step guide for Example
sample code block
I can personally vouch for the quality of Jonathan Regenstein's book and associated shiny apps. Very easy to follow along and well-structured. I also appreciate the ability learn code in xts, tidyverse, and tidyquant/tibbletime side-by-side. Especially when you're attempting to go from a novice-level R user (using xts objects in my case) to a person looking to build shiny apps.