i Invest Strategies
- jim mason
- jimm1
- Jim Mason
Key Points
- create your AMSGPSL Financial strategy ( or update it ) BEFORE creating an investment plan
- based on your financial goals, decide what investment "sleeves" you need to create
- decide which, if any, of the sleeves you should actively manage
- all trades need a trade management plan for the investment life cycle BEFORE the trade is placed
- use Fidelity Learn to Invest pages and links here about different investment types and strategies
- based on your skills and interests, decide what you can manage and how you should manage it
- decide who to partner with for solid, low-cost investment advice
- key question - how to manage a losing position or a risky position
#Fidelity
General questions
800-343-3548
References
Key Concepts
Warren Buffett observation that “the stock market is a device for transferring money from the impatient to the patient.”
https://www.yahoo.com/finance/news/janitor-built-8-million-fortune-185251227.html
Charlie Munger on Investing and Life
“[Charlie’s] most important architectural feat was the design of today’s Berkshire. The blueprint he gave me was simple: Forget what you know about buying fair businesses at wonderful prices; instead, buy wonderful businesses at fair prices,” Buffett wrote.
Buffett also learned the importance of knowing one’s circle of competence from Munger.
Charlie taught me about durable competitive advantage — not how big circle of competence is, but knowing where the edges are most important," Buffett said
Well it’s a hugely important thing, knowing the edge. It’s hardly a competence if you don’t know the edge of it. You know, if you have a misapprehension regarding your own competency that means you lack competence, you’re going to make terrible mistakes. I think you’ve got to constantly measure what you achieve against other people of achievement, and you have to keep being determinedly rational, and avoiding a lot of self-delusion,” Munger said
To make better decisions in business and life, Munger often deployed what he called a “latticework” of mental models.
“You’ve got to have models in your head. And you’ve got to array your experience — both vicarious and direct — on this latticework of models. You may have noticed students who just try to remember and pound back what is remembered. Well, they fail in school and in life. You’ve got to hang experience on a latticework of models in your head,” Munger said
One of the ideas I came up with, which wasn’t in any of the books, was that the 'lollapalooza effects' came when three or four of these tendencies were operating at once in the same situation. I can see that it wasn’t linear,” Munger said.
When asked about relationship advice and finding a good spouse, Munger said, “The best single way is to deserve a good spouse.”
Munger often said the secret to a long and happy life is "simple."
“You don’t have a lot of envy, you don’t have a lot of resentment, you don’t overspend your income. You stay cheerful in spite of your troubles. You deal with reliable people, and you do what you’re supposed to. All these simple rules work so well to make your life better, and they’re so trite.”
https://finance.yahoo.com/news/charlie-munger-rule-happy-life-141605326.html
“A happy life is very simple,” the 97-year-old Munger said during the Annual Meeting of Shareholders of the Daily Journal Corporation (DJCO). “The first rule of a happy life is low expectations. That’s one you can easily arrange. And if you have unrealistic expectations, you’re going to be miserable all your life."
Munger, who is the chairman of the Daily Journal's board, added that "I was good at having low expectations and that helped me. And also, when you [experience] reversals, if you just suck it in and cope, that helps if you don't just stew yourself into a lot of misery."
https://finance.yahoo.com/news/career-advice-charlie-munger-buffett-155842582.html
I think the right strategy for the great mass of humanity is to specialize,” Munger said. “Nobody wants to go to a doctor that’s half proctologist and half dentist, you know? So, the ordinary way to succeed is to narrowly specialize.”
“Warren and I didn’t really do that,” he continued. “We prefer the other type of activity. But I don’t think we can recommend it to other people.”
Successful Investor Traits and Behaviors **
Humility
You can know a lot about a given company
You can't know where the market will be overall and that will have an impact on any company
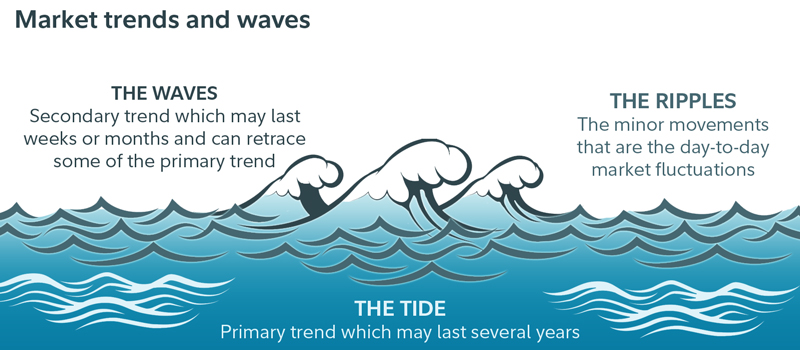
Dow Theory - market averages built from tides, waves and ripples
https://www.fidelity.com/viewpoints/active-investor/dow-days-of-summer?ccsource=email_weekly_AT
volume should confirm trends - moving average periods for waves vs tides
do the Dow Industrials confirm the Dow Transport trends and vice versa?
Warren Buffett's 2025 Annual Letter has great understanding of how America works and how normal people can do well - can't be beat
Buffett-Letter-2025-Full.pdf. GD
Buffett-Letter-2025-Full.pdf. file
Jim on Longer-term market investments lowers risk of loss
Question >> IF I invest now and the S&P500 index drops 10% or more, will I recover my loss in 24 months or less?
History after 1960 shows: 8 times you had a gain in less than 24 months, 3 times it more than 24 months to show a gain - 73%
Long-term the market rises. Yes from 2001 to 2010 was the "lost" decade before the market rose. My research says since 1950 there were only 3 times the SP500 index took longer than 24 months to exceed its prior high AFTER a 10% drop. IF I buy with the assumption that I will commit to 24 month minimum, only 3 times did I not see a gain. There were 6 times the market bounced back from a 10% or greater drop in less than 24 months. For me, it's how much am I willing to commit for 24 months or more
caq>> create a detail table and a mermaid chart that shows each time the S&P 500 index dropped 10% or more how long it took in months before the S&P 500 exceeded that prior peak.Highlight in red each instance where the time to exceed the prior S&P 500 index was longer than 24 months. Highlight all other occurrences in dark green.
The S&P 500 index has experienced multiple instances where it declined by 10% or more, followed by varying durations to recover and surpass the previous peak. Below is a detailed table summarizing these occurrences, highlighting in red those instances where the recovery took longer than 24 months, and in dark green those that recovered within 24 months.
Table: S&P 500 Declines of 10% or More and Recovery Durations
| Peak Date | Trough Date | Decline (%) | Months to Trough | Months to Recovery | Cause | Highlight |
|---|---|---|---|---|---|---|
| Sep 1929 | Jun 1932 | -86% | 33 | 300 | Great Depression | Red |
| Mar 1937 | Mar 1938 | -54% | 13 | 107 | Recession | Red |
| May 1946 | Oct 1946 | -27% | 4 | 46 | Post-WWII adjustments | Red |
| Aug 1956 | Oct 1957 | -22% | 15 | 14 | Recession | Dark Green |
| Dec 1961 | Jun 1962 | -28% | 6 | 14 | Cold War tensions | Dark Green |
| Feb 1966 | Oct 1966 | -22% | 8 | 7 | Fed tightening | Dark Green |
| Nov 1968 | May 1970 | -36% | 18 | 21 | Recession, Vietnam War | Dark Green |
| Jan 1973 | Oct 1974 | -48% | 21 | 69 | Oil embargo, Watergate | Red |
| Nov 1980 | Aug 1982 | -27% | 20 | 3 | Volcker's interest rate hikes | Dark Green |
| Aug 1987 | Dec 1987 | -34% | 3 | 20 | Black Monday | Dark Green |
| Jul 1990 | Oct 1990 | -20% | 3 | 4 | Gulf War | Dark Green |
| Mar 2000 | Oct 2002 | -49% | 30 | 56 | Dot-com bubble burst | Red |
| Oct 2007 | Mar 2009 | -57% | 17 | 49 | Global Financial Crisis | Red |
| Feb 2020 | Mar 2020 | -34% | 1 | 5 | COVID-19 pandemic | Dark Green |
S&P 500 Index drops greater than 10% where market recovery was less than 24 months or longer than 24 months

mermaid code
Note: In the chart above, periods where the recovery took longer than 24 months are grouped under "Recovery > 24 Months," while those with recovery within 24 months are under "Recovery ≤ 24 Months." This visualization illustrates the duration and severity of significant S&P 500 declines and their subsequent recovery periods, highlighting the resilience and cyclical nature of the market over time.
Is the Market Overpriced now? Jurien Timmer
We are now in the thick of earnings season, with 124 companies reporting so far, and a lot more reporting this coming week (including the big tech companies). So far, 78% are beating estimates by an average of 6%. It’s below average, as the chart shows, but with so many bellwethers reporting this week I will reserve judgement for now.
One thing is clear: the market has rallied a lot in anticipation of an earnings recovery, with the forward P/E ratio expanding from 15.3x at the October 2022 low to 20.1x today. History shows that we have reached that part of the cycle where the baton gets passed from multiple-expansion to earnings growth. With a consensus forecast of 11% growth, those earnings would have to come through this year. If so, this should allow the P/E ratio to come down and the equity risk premium (ERP) to revert from 3.7% to a more typical 5%. A 5% ERP at 6% earnings growth is a more reasonable 17x multiple.
240205 - new SPX highs bring loftier P/E ratios, with the trailing P/E multiple now reaching 22.4x.
A matter of when, not if. The new highs continued last week, and the S&P 500 index is now approaching the upper band of its rising channel. With those highs come ever loftier P/E ratios, with the trailing P/E multiple now reaching 22.4x.
As I noted last week, new all-time highs (ATHs) following a correction tend to produce strong momentum. Whereas the S&P 500 price index normally goes up 8.5% per year with a batting average of 73%, following a new high those numbers climb to +13.8% and 89%.
But just because the market has momentum doesn’t mean it’s immune to corrections. Some of history’s biggest bear markets have occurred a few months after the market presumably got the all-clear signal. The S&P 500 performance following new all time high chart shows the worst drawdowns and best “draw-ups” following a new ATH. There are a couple of doozies in there. Enjoy the ride, but don’t get complacent.


<<Jim
What is significant about your posts for me is the ability to represent potential forward views of the market along with key factors likely to be drivers. Your assessments provide enough "meat" that we can add our own factors or define our own weights for key factors to see different potential outcomes. Your market insights are the "best fuel" I've ever seen to build forward scenarios and define successful related investment strategies including reactives ones.... a long way to say you've helped me make money and thanks
Whole Life Insurance Annuity Concepts

Whole life and universal life insurance are ideal for estate planning. Extensive evidence and logical reasoning strongly support this claim. Given the urgency and significance, these policies must be considered. The formal style ensures well-structured sentences, sophisticated vocabulary, and a clear introduction, body, and conclusion. Contractions and colloquial language are avoided. The authoritative and objective voice presents information neutrally, enhancing credibility. https://mytopinsuranceblogs.com/what-role-life-insurance...


Real estate - REITS vs Fractional Ownership Pools
https://www.yahoo.com/finance/news/era-real-estate-investing-simpler-122557672.html
real-estate-The New Era Of Real Estate Investing - A Simpler Path To Building Wealth.pdf
real-estate-The New Era Of Real Estate Investing - A Simpler Path To Building Wealth.pdf file
Fund Strategies
ETF vs Mutual Fund
usually lower fees in most cases
clearly more liquid without NAV premiums or discounts
mutual funds have higher minimums, increments usually
funds may load and redemption fees as well
GLVAX - Global Asset Fund - high risk
https://fundresearch.fidelity.com/mutual-funds/summary/00900W704?type=sq-NavBar
very good recent performance but 5.5% load fee and higher risk
does well in economic recoveries
20% return over last 5 years
FSMDX - Fidelity Multi-Asset Income Fund - normal risk
https://fundresearch.fidelity.com/mutual-funds/summary/31638R717
Allocation--30% to 50% Equity
Average Annual Returns
| 1 Yr | 3 Yrs | 5 Yrs | Life |
|---|---|---|---|
| +19.08% | +11.44% | +11.23% | +9.87% |
low annual expenses - 0.91%
no other fees
no minimums
net assets $450 M
turnover 465%
Overview
Objective
The fund seeks to provide a combination of income and capital appreciation.
Strategy
Normally investing primarily in income producing securities of all types. Allocating the fund's assets among equity and debt securities, including common and preferred stock, investment-grade debt securities, lower-quality debt securities (those of less than investment-grade quality, also referred to as high yield debt securities or junk bonds), floating rate securities, and convertible securities. Investing in domestic and foreign issuers. Allocating assets across different market sectors and maturities. Analyzing a security's structural features and current pricing, its issuer's potential for success, and the credit, currency, and economic risks of the security and its issuer to select investments. Adjusting allocation among asset classes to take advantage of short-term market opportunities and strategic, longer-term opportunities.
Risk
Stock markets, especially foreign markets, are volatile and can decline significantly in response to adverse issuer, political, regulatory, market, or economic developments all of which are magnified in emerging markets. Fixed income investments entail interest rate risk (as interest rates rise bond prices usually fall), the risk of issuer or counterparty default, issuer credit risk and inflation risk. Foreign securities are subject to interest rate, currency exchange rate, economic, and political risks all of which are magnified in emerging markets. Lower-quality bonds can be more volatile and have greater risk of default than higher-quality bonds. Floating rate loans may not be fully collateralized and therefore may decline significantly in value. Moreover, they may be subject to restrictions on resale and sometimes trade infrequently in the secondary market; as a result they may be more difficult to value, buy, or sell. If the fund's asset allocation strategy does not work as intended, the fund may not achieve its objective.
ETV - Eaton Vance Opportunities Fund - buy write large cap
keys
- 8 pct yield paid monthly
- some appreciation focused on large cap tech
- total return should average over 10 pct long term
- does have a NAV premium of 7 pct now
ETV 8 pct Distribution Yield Paid Monthly equity buy write fund.pdf
Alger Dynamic Opportunities Fund Class A - sample good fund, high fees
Here's a good fund with high sales load, annual fees
https://fundresearch.fidelity.com/mutual-funds/fees-and-prices/76882K850
10 yr return to 2021
10% annual return
SP500 was 15% annual return
Mixed Index Allocation Strategy - For long-term results, mix SP500 index ETFS
consider mix of:
- SP500 high yield - VYM - VANGUARD HIGH DIVIDEND YIELD INDEX FUND
- SPY - SP500 index
- SSO double SP500 - double leverage
- TWM SP500 triple inverse - a ST momentum play on a buy stop to avoid liquidations IF fundamentals good despite market issues
- FSMDX - Fidelity Multi-Asset Income Fund - equity - income allocation
consider rebalance allocations based on overall momentum
relative 5 year performance showing average returns and volatility

Portfolio insurance from fast market drops for bull spreads
Where there is significant downside risk ( eg credit put spreads or debit call spreads )
consider a 10% reserve of cash margin for retirement accounts or 25% of equity margin for brokerage accounts
use a tiered strategy of automated orders triggered on SPX declines with:
- a trailing buy stop at 5% below SPX peak of SDS at 5% of the cash reserve at market
- a trailing sell stop where the bull spreads on an equity have declined 3% from the entry point to average out of 50% the spreads at a loss
- a trailing sell stop where the bull spreads on an equity have declined 5% from the entry point to average out of 50% the spreads at a loss or roll down and out
- a trailing buy stop at 10% below SPX peak of SDS at 5% of the cash remaining reserve at market
The SDS gains SHOULD offset the losses on bull spreads despite the large market drop
The cost is keeping a margin reserve to buy the SDS
Debt Strategies
Preferred Stock
PGX
Bonds
I Bonds - Gov issued, floating rate adjusted every 6 months
Equity Strategies
Buffett Investing Concepts
Buffett 2023 Annual Letter Summary
_2024-Warren-Buffett-s-2024-annual-letter-to-shareholders.pdf link
_2024-Warren-Buffett-s-2024-annual-letter-to-shareholders.pdf file
- Munger architected Berkshire: "buy wonderful companies at fair prices" ( wonderful = good economics that are fundamental and enduring.)
- Focus on the elements that create operating income, not net income, to understand the value of a business
- America has been a terrific country for investors. All they have needed to do is sit quietly, listening to no one
- As Ben Graham taught me, “In the short run the market acts as a voting machine; in the long run it becomes a weighing machine.”
- We also hope these favored businesses are run by able and trustworthy managers
- All in all, we have no possibility of eye-popping performance - just steady gains through good management
- Berkshire should do a bit better than .. average .. and ... should also operate with materially less risk of permanent loss of capital.
- Work for shareholders > We never forget that, though your money is comingled with ours, it does not belong to us.
- markets now exhibit far more casino-like behavior ( creating value opportunities )
- Berkshire plan: Never risk permanent loss of capital. Invest smart
- Thanks to the American tailwind and the power of compound interest, the arena in which we operate has been – and will be – rewarding if you make a couple of good decisions during a lifetime and avoid serious mistakes.
- Berkshire is built to last. ( Berkshire doesn't use significant debt for it's operating success )
- our share of AMEX earnings in 2023 considerably exceeded the $1.3 billion cost of our long-ago purchase. ( Long-term holdings can pay off big )
- Characteristics of a few companies Berkshire invested in that have rising share values:
- applying only about 1⁄3 of its earnings to dividends.
- retained cash flows are used both to build their many businesses and to repurchase shares at attractive prices
- Like Berkshire, the five companies are reluctant to issue shares
- Berkshire's letter provides clear focus on operations and very conservative evaluations of the future operating risks for each business
Distributions - Return of Capital vs Dividends vs Capital Gains
https://www.treasury.gov.za/public%20comments/STC%20Discussion%20Document%20%2020%20Feb%202008.pdf
Shareholders can withdraw their initial tax contributions, or shareholders can withdraw excess funds generated out of company profits (i.e. growth). The tax system (currently in the form of the Secondary Tax on Profits) seeks to tax only profits – not returns on initial investment. The question is how to distinguish between the two.
Return of Capital Distributions - How they work
https://www.investopedia.com/terms/r/returnofcapital.asp
Return of capital (ROC) is a payment that an investor receives as a portion of their original investment and that is not considered income or capital gains from the investment. Note that a return of capital reduces an investor's adjusted cost basis. Once the stock's adjusted cost basis has been reduced to zero, any subsequent return will be taxable as a capital gain.
KEY TAKEAWAYS
- Return of capital (ROC) is a payment, or return, received from an investment that is not considered a taxable event and is not taxed as income.
- Capital is returned, for example, on retirement accounts and permanent life insurance policies; regular investment accounts return gains first.
- Investments are composed of a principal that should generate a return; this amount is the cost basis. Return of capital is the return of the principal only, and it is not any gain or any loss as a result of the investment
Roll losing equity position into similar high yield equity
dgi-fmr-screen
dgi-210108-screener_results.xls
| sel | Symbol | Company Name | Roll? | Security Type | Security Price | Equity Summary Score from StarMine from Refinitiv | Dividend Yield | Volume (90 Day Avg) | Dividend Payout % (Last Quarter) |
| 1 | ARCC | Ares Capital Corp | 1 | Common Stock | 16.96 | Neutral | 9.44 | 2.049 | 38.322 |
| 1 | NLY | Annaly Capital Management Inc | 2 | Common Stock (REIT) | 8.205 | Bullish | 10.706 | 12.865 | 35.223 |
| 1 | ORC | Orchid Island Capital Inc | 3 | Common Stock (REIT) | 5.24 | Very Bullish | 14.829 | 1.106 | 42.944 |
| 2 | BGS | B&G Foods Inc | 3 | Common Stock | 27.27 | Very Bullish | 6.803 | 1.059 | 65.102 |
| 2 | STWD | Starwood Property Trust Inc | 3 | Common Stock (REIT) | 18.695 | Bullish | 10.213 | 2.5 | 91.444 |
| 3 | BNS | The Bank of Nova Scotia | 4 | Common Stock | 53.73 | Very Bullish | 5.173 | 1.245 | 50.782 |
| 3 | VICI | VICI Properties Inc | 4 | Common Stock | 25.685 | Bullish | 5.301 | 4.506 | 39.835 |
| 3 | GSK | Glaxosmithkline PLC | 3 | Depository Receipt | 38.39 | Bullish | 5.332 | 4.388 | 73.548 |
| 3 | NYCB | New York Community Bancorp Inc. | 4 | Common Stock | 10.925 | Neutral | 6.199 | 4.172 | 81.836 |
| 4 | IBM | International Business Machines Corp | 4 | Common Stock | 127.676 | Neutral | 5.055 | 5.295 | 85.571 |
| 4 | FE | FirstEnergy Corp. | 3 | Common Stock | 29.825 | Neutral | 5.265 | 5.909 | 46.087 |
IF market clearly oversold or undersold, average into SPX 2X ETF ( SSO, SSD )
https://seekingalpha.com/article/4519264-recession-headwinds-do-not-buy-the-dip-yet
market-when-to-buy-for-recession-2022-seekingalpha.com-Dont Buy The DipYet.pdf
We are just starting to see a market drop that is associated with a possible recession. If we don't get a recession, then a good case can be made we are at or near bottom. But based on the headwinds I mentioned earlier, I believe a recession is highly likely. The stock market has dropped much more than the current 18-32% in the last 5 recessions.
Consider the following 3 indicators for when it is time to buy this dip.
Watch the economic surprise index trend.
It is an aggregation of economic statistics showing whether they beat or missed economists' expectations. Right now, it is trending rapidly downward. Once it is solidly back in positive territory is a buying signal.
Bloomberg and Citi source - economist forecasts have been higher than actual results, wait for positive surprises
Don't fight the Fed. Wait until the Fed is done or is indicating it will soon be done.
is most bad news ahead or behind us now?
Wait until the barrage of bad news slows. The market is news-driven and bad news drives it down. Why fight that? There is always a lot of bad news going into a recession. Most of that is ahead of us. Also, if the bad news stops driving the market down, that is also a buying signal.
Is market drop deflation of market prices or actual earnings drops ( like a recession )?
The bubbles we had are mostly deflated, though these often overshoot to the downside. That deflation has driven most of the market decline to this point. A recession is a different situation. It causes further market losses due to declining earnings estimates.
Search: undervalued, good performers with earnings, dividends
https://seekingalpha.com/article/4425879-10-best-value-picks-among-dividend-aristocrats
screener criteria
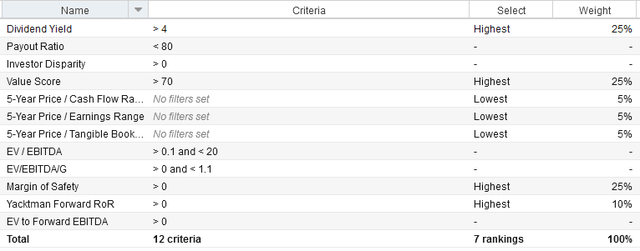
screener results - 210508
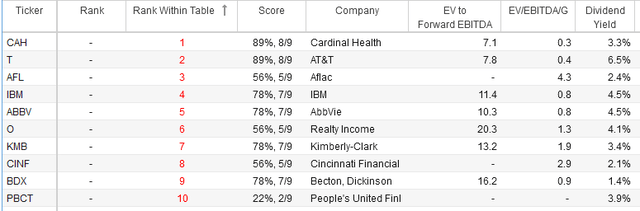
Cardinal Health (CAH), AT&T (T), Aflac (AFL), IBM (IBM), AbbVie (ABBV), Realty Income (O), Kimberly-Clark (KMB), Cincinnati Financial (CINF), Becton, Dickinson (BDX), and People's United Financial (PBCT) get the highest rankings here
Some of these are likely to continue revenue losses ( IBM )
CAH - Opioid-related lawsuits have hurt sentiment around Cardinal Health's shares, which is why they trade at a quite low valuation today
AT&T isn't a great buy-and-hold-forever pick.
IBM's unconvincing growth in recent years
ABBV - Management is convinced that sales will be higher in the mid-2020s compared to now, and in the meantime, Humira's strong cash flows can be used to finance tuck-in acquisitions, debt reduction, or growth investments.
CNF - The company is a quality pick that offers very reliable dividend growth, but compared to the likes of Aflac, it looks like a weaker choice.
PBCT - At 14 times net earnings, PBCT trades at a discount to the longer-term average earnings multiple, and shares also are not expensive versus other bank stocks.
Find Growth Companies with Unique Value Add and Recurring Revenue Models
https://www.fool.com/investing/2021/09/05/3-growth-stocks-thatll-make-you-richer-by-2024/
- Companies with recurring revenue are often more effective at expanding over time than those without.
- Innovation is expensive, but it can pay off big over time.
- New products can succeed by avoiding the longstanding, frustrating weaknesses of the competing options.
Examples
Intuitive Surgical (NASDAQ:ISRG) sells robotic surgery units to hospitals around the world, and business is booming. Even amid the economic disruption of the pandemic, the company increased its base of installed systems by 10% between June 2020 and the same period in 2021. That's a strongly positive sign for Intuitive's future, as every installed robotic surgery system implies significant future revenue from maintenance and sales of fresh tools and accessories. In 2020, a stunning 77% of its revenue was recurring.
ALGN
By solving a key problem with a formerly dominant legacy product, Align has had an easy time finding prospective customers and gaining market share. Internet searches for doctors capable of fitting patients for Invisalign increased by 82% year over year in Q2.
Align also sells imaging technology to dental care professionals, which they can use to fit their patients for the company's straighteners. So, it makes money first when customers want to have the ability to sell its main product, and then again when customers buy cases of straighteners to distribute to patients. And sales are hot: In the second quarter of 2021, revenue from imaging systems rose by a whopping 20% sequentially, and income from cases of aligners rose by 11.6% sequentially, making for more than $1 billion in total revenue for the period.
DXCM
when patients exhaust their supply of wearable sensors, they'll need to put in an order for another case. So there's a recurring component to DexCom's revenue base, which helps it grow more consistently.
Much like with Align Technologies, DexCom's product practically sells itself just because it doesn't have the fundamental flaws of the traditional option. Thus, it's no surprise that the company's total revenue grew by 32% year over year to reach $595 million in the second quarter of this year. What's more, management expects its gross profit margin to rise to 67%, an even larger increase than it initially predicted for 2021.
Strategies and Tools to limit risks
Invest Tools#FidelityToolsandStrategiesforExitingtrades
Risks to manage
- Black swan events
- Economic events
- Market events
- Sector events
- Company events
- PE compression
Entry and management strategies need to account for these risks
Entry strategies to limit risk
- set a gain strategy
- confirm market, sector and company forecasts for ST, MT, LT expectations
- set a trade management plan
- plan around eps announce dates for company, key competitors
- look at eps and revenue expectations missed in past year, coming 6 months
- look at market and analyst reviews for potential PE compression
- set risk limit strategies
- set Black Swan plan
- avoid high volatile stocks for options
- find Support Resistance lines
- find the 90% support price level by expiration
- choose shortest term options
- for an account, invest in at least 2 separate stock options to minimize risk
Exit strategies to limit risk
- set price alert points from price probabilities by expiration - 70%, 60%
- set average out orders
- set average down and orders
- set trailing stop loss orders outside normal day range
- for credit spread orders, consider
- average down on a losing trade: at the alert point sell at least half of the position
- consider buying the higher priced short position back on the alert point
- assumes the trend continues and lower priced long position will continue to grow in value as the bad trade direction continues
- using a sell stop limit order or a trailing stop limit order, let the long position grow in value until the trend reverses and then automatically sell on the reversal
- odds are good you have narrowed the loss the credit spread by buying the credit back before selling debit ( long ) position
- more
Compare SP500 Performance against Portfolio Performance

#SmithDiv - A 9%-Yielding Portfolio With Low-Risk Dividends For Sustainable Passive Income
Why this portfolio?
passive income investing brings with it several other benefits:
- It allows for the preservation of principal while living off the income produced, thereby reducing concerns about short-term market volatility, and steering the investor's focus instead on the quantity and quality of the dividend cash flow coming in. As a result, while many are panic-selling during a market crash, a passive income investor can adopt the mantra of: "Keep calm, and let the dividends flow."
- It also can generate long-term capital appreciation, as many high-yield stocks still retain significant amounts of cash flow net of their dividend payments which they use to grow their intrinsic value via buybacks and/or reinvesting into growth.
- It mitigates the sequence of returns risk that is the biggest challenge with following the 4% Rule, thereby helping to ensure the principal longevity and purchase power sustainability of a retirement portfolio.
| Tickers | Amount | % Allocation | Dividend | Yield | Real Estate Loan Risk |
| PFFA | $330,000 | 30.00% | $32,340 | 9.80% | Low |
| ET | $82,500 | 7.50% | $7,508 | 9.10% | None |
| BXSL | $82,500 | 7.50% | $9,075 | 11.00% | Medium |
| JEPI | $275,000 | 25.00% | $22,825 | 8.30% | Low |
| RQI | $110,000 | 10.00% | $9,020 | 8.20% | Medium |
| UTF | $220,000 | 20.00% | $19,140 | 8.70% | Low |
| Total | $1,100,000 | 100.00% | $99,908 | 9.08% |
- Virtus InfraCap U.S. Preferred Stock ETF (PFFA): PFFA pays out a monthly dividend, combining with the JEPI, RQI and UTF positions to deliver attractive monthly income that's supplemented on a quarterly basis by ET and BXSL payouts. PFFA's distributions should be quite sustainable through most economic downturns given that the portfolio is well diversified with 204 individual preferred stocks along with a modest dose of leverage to enhance the yield further. Since preferred dividends must be paid out in full before any common dividends can be distributed, preferred dividends are often quite safe through recessions and only come into question if a company becomes financially distressed. The fact that this ETF also is actively managed further reduces the risk of meaningful dividend cuts. Given its likely safety through downturns and attractive yield, we give it the largest single position in our portfolio at 30%.
- Energy Transfer LP (ET): ET has near 2.0x distribution coverage on a distributable cash flow basis, has one of the largest and best-diversified midstream infrastructure portfolios in North America, has a solid BBB balance sheet that continues to get better as the company continues to deleverage (including recently announcing the redemption of nearly all of its preferreds), has very low (~10% of adjusted EBITDA) exposure to commodity price swings, and is set to continue growing its distribution at a 3%-5% CAGR for the foreseeable future. Note that ET issues a K-1 tax form. You can invest in Canadian alternatives like Enbridge Inc. (ENB), a U.S. C-Corp like Kinder Morgan, Inc. (KMI), or a midstream ETF, Global X MLP ETF (MLPA); Global X MLP & Energy Infrastructure ETF (MLPX) to avoid the K-1. However, the yield will not be quite as attractive as what is available with ET.
- JPMorgan Equity Premium Income ETF (JEPI): JEPI enhances our portfolio's diversification by providing us with diversified exposure to large-cap stocks, including mega-cap technology companies like Amazon.com, Inc. (AMZN), Meta Platforms, Inc. (META), and Microsoft Corporation (MSFT). By using a covered call-like strategy, JEPI is able to generate significant cash flow each month, which it distributes to shareholders as a dividend. Given the massive market cap of its holdings, we make this fund an outsized portion of our portfolio at 25%.
Cohen & Steers Infrastructure Fund (UTF): UTF is managed by the same company as RQI and has a similarly impressive track record of sustaining its impressive monthly distribution through COVID-19. Between RQI and UTF, we get an attractive and diversified exposure to real assets, with 203 individual holdings in RQI and 254 individual holdings in UTF.
ensure that those businesses continue to have:
- Defensive and durable business models.
- Strong balance sheets.
- Conservative payout ratios.
If one or more of these qualities is no longer the case, the dividend could very possibly be at risk, and therefore it may be prudent to recycle the capital elsewhere. Regarding the funds, their internal diversification helps a great deal with mitigating the risk of any major dividend cuts. Moreover, maintaining proper diversification in the context of the broader portfolio helps as well.
In summary, the biggest risk to this strategy is dividend cuts,
JIm>> Key Risks in these investments where real estate loans are significant part of fund or company assets
Commercial real estate loans focused on office buildings everywhere have yet to reflect the loss in value of those buildings. Lenders often carry the loan asset values at book value without marking down to market value for expected losses when borrowers can't make loan payments. Lender financials DO accurately reflect actual losses on payment defaults. The reserves for future payment defaults may be very unrealistic. You need to research management discussions of those risks and the planned reserves for losses. As a result, I tend to underweight investments in funds with significant loan assets in commercial real estate focused on first office buildings and second shopping malls. Solid analysis requries evaluating the individual loan assets for local market demand forecasts for the office buildings and malls since that varies significanlty from one locality to another. Lower risk real estate loans are normally in medical facilities and maybe warehouses where demand is less likely to decline in most markets.
#Jim100 - Moderate Risk Return 1 Portfolio
Goals
- High dividend securities -
- 60 to 90 % high yield, low volatility, good payout ratios, low EPS risk dividend companies with good market position, forecasts
- 0 to 30% in growth securities
- 5 to 20% cash
- expect 6 to 9% cash flow from dividends for the whole portfolio
- expect moderate long-term sustainable growth
- SPX trend returns - 0 to 20 % "dry powder" funds that move in or out of SSO ( SPX 2X leverage ) to capture SPX changes up and down as trend tracking
- Key ETF funds - 0 to 20 % ( candidates include XNTK etc )
Assumptions
- High dividends - require minimal management - just alerts on large price swings, quarterly review of company earnings potentials and threats
- SPX trend returns - require alerts to act on trends using dollar averaging on trend moves to move in or out of SSO capturing most of trend gain, minmizing most of trend losses
- expectation is manual management with triggers to move in or out between SSO and cash is not exact, can't be perfect - only capture SOME of the potential gain and minimize SOME of the potential losses.
- bet is some trend following will generate higher returns than losses overall compared to buy and hold SSO long-term
- only open SSO positions when SPX is average or good PE. close some SSO when SPX is highly over valued PE on a downtrend of 5 - 10% in price
- Assume SSO = 15% and Stocks = 85% with ave div yield of 9% >> whole portfolio returns 7.65% of cash flow with chance to catch 30% of SPX gain
- Based on 2000 - 2024 SPX performance, JIM100 Portfolio would beat 14 out of 20 years, get 80% of SPX on average the other 6 years
Performance Expectations
- When SPX loses for the year, Jim100 returns at least 6% or better cash for the year
- When SPX gains less than 10% for the year, Jim100 returns 11% or better - 8% cash for the year
- When SPX gains 10 - 15% for the year, Jim100 returns 14% - 8% cash for the year
- When SPX gains 20% or more for the year, Jim 100 returns 15% - 8% cash for the year
Is the market expensive or affordable? SPX PE ratio
https://www.gurufocus.com/economic_indicators/57/pe-ratio-ttm-for-the-sp-500
Forecast of Historical Results for JIM100 fund vs SPX annual higher years
TMP - Trade Management Plans
- It's not managing a single trade
- it's managing the portfolio
- it's managing the investment over a life cycle ( not just a single trade )
- it's making adjustment trades as the initial trade moves for or against goals
- it's managing within your risk profile before you look at returns
- it's evaluating a trade return on a normalized basis ( risk rating, annualized return )
- it's finding confirmations for a trade or a trade adjustment
- it's avoiding increased risk ( holding a trade through an earnings announcement for a company or it's largest competitors )
- it's managing risk using the Fidelity price probability calculator
- it's about making many small bets that validate probability over time vs making a few large bets that may not fit probabilities
TMP todo
evaluate BUY STOP - to reduce credit option loss by X% when the alert price hit
consider setting up small buy stops to reduce position when trade moves past alert point in the wrong direction
evaluate OTO - one triggers the other orders
TEP - Trade Entry Plans
GSheet with Planned Trades
Magnificent 7 Stocks
2024
Alphabet’s earnings arrive at a moment when the standing of Big Tech’s financial performance has never been more evident on Wall Street. The muscular earnings growth among the tech giants is expected to continue to drive the market rally, as the biggest names from California and Washington state lift up the S&P 500. Alphabet is among an elite handful of tech names that are expected to grow earnings by almost 80% in the first quarter of 2024, according to data from FactSet. The other 496 companies are collectively expected to grow earnings by 0.3%.
Options Strategies
https://www.fidelity.com/learning-center/investment-products/options/options-strategy-guide/overview
https://docs.google.com/spreadsheets/d/1Vlgr7l2C9v671eE7lJx2lQN9ChlhT3t-/edit#gid=1407435733 - gsheet
Credit Spread
sell an option, buy an option at different strike to create a credit
assumes price won't move to the sold option strike
consider >> far OTM credit spreads with low execution risk
Credit Spread Entry Plan
-----------------------------
entry criteria for bull credit spreads
-----------------------------
market - no high risk forseeable events ST
sector - sector is not negative
company
- no major competitor change - eps dates seen
- neutral or better rating
- no eps dates
- lower pe vs sector
- lower beta
- under valued
- ST, MT signals neutral or better
- 90% support strike for credit
- find "close" long - short spreads ( eg 39-40 not 50-52.5 )
Credit Spread Entry Example
t210125 candidate weekly credit spreads
------------------------
CSCO
-CSCO210219P41 40 C .37 .25 .11
20 = 2000 for net gain 200
91% win rate at 41
71% win rate at 43 - alert point
roll down, out
-CSCO210319P40 39 C .53 .43 .10
partial offset loss on prior trade
41 40 will 1.19 .98 .24 ( loss of .14 )
IRA 100 contracts = 10K 1K gain
Roth 200 contracts = 2K 200 gain
Candidate Option TEP for Credit Spreads
after setting up a TEP ( trade entry plan ) often with a limit order to open for a net credit of X
- set the alert action point ( AAP ) for the trade at about 70% price probability of hitting the credit strike
t210211 option candidates
------------------------WMT next eps 2/18
sell WMT210319P135 - 130 = .80 net @ 90 pct
HPQ next eps 2/25 then
HPQ210319P24 - 23 = .10 net
or adjust based on eps net
ORCL next eps 3/11 then 63.11
ORCL210416P60 - 57.5 = .65 net @ 75pct
ORCL210416P57.5 - 55 = .21 net @ 90 pct
or adjust based on eps net
BAC BAC210319P29 - 28 = .09 net @ 85 pct
INTC next eps 4/23
undervalued
sell INTC210319P52.5 – 50 = .18 net @ 80 pct
AMGN next eps 4/28
undervalued, bullish, support 227.5 @ 80 pct
sell AMGN210319P225 - 220 = .65 net @ 80 pct
DELL next eps 2/25
sell DELL210319P70 - 67.5 = .25 net @ 90 pct
ABBV next eps 4/29, undervalued
sell ABBV210319P97.5 - 95 = .36 net @ 80 pct
MS next eps 4/14
sell MS210319P67.5 - 65 = .23 net @ 80 pct
Use the TMP ( trade management plan ) to manage the option spread position when it moves for or against
when that occurs, the TMP ( trade management plan ) may:
- decide if the stock, sector, market still look strong or not
- take a small loss on a portion of the position to average out of the trade
- roll down and out on spread strike and expiration ( often for no loss except for added duration of N months )
- update the AAP - alert action point on price
Credit Spread TMP
Credit Spread TMP example - negative price move
Credit Spread TMP errors example
------------------------
t210129 manage vz spread, vz errors
------------------------
vz errors
rolled out across earning date
didn't anticipate competitor earnings dates impacts
didn't average in to large position based on good price movement
didn't average out after initial sell price hit
Debit Spread
buy an option, sell an option at different strike to create a debit
assumes price will move above the purchased option strike
consider > deep ITM debit spreads with low return but high win probability
Risk: Limited to loss of net premium to open position
Profit: Limited to max of spread strikes minus premium cost
When to use
If both options are deep ITM, then risk spread won't be realized is low
Potential gain on deep ITM spread is also low
Manage negative move
Set alert at a price level before lower priced option is hit. The max profit occurs IF the full spread exists at expiration.
Cover 1 - assume negative price trend continues
sell the long option which still has value
assumes the prices will continue to erode so there is some gain on the short option declining in price
Expected net result? small loss
Cover 2 - assume prices decline will stop or reverse
hold spread
FMR references
https://researchtools.fidelity.com/ftgw/mloptions/goto/strategyScreener
Calendar Spread - debit or credit
if bull, sell ST option, buy LT option at same strike
assumes price will move in LT direction creating value
Diagonal Roll ** management strategy
A calendar and a price roll for an option or spread position.
Usually an option to manage an unfavorable price trend on existing option position.
If done right at the right time, the losing spread position can be rolled to a small gain or loss at a future date.
Positives
minimize loss vs straight sale of option
Negatives
credit spread losses widen normally on negative price trends toward expiration with the long farther OTM option declining faster
Extending the trade position longer at a lower gain reduces the return while tying up capital
A straight loss costs more now but will free up capital sooner
Double Diagonal Spreads - bet on short-term expiration
Near-term strangle is sold against the simultaneous purchase of a longer-term strangle. The strike price of the call on the long strangle is higher than the strike price of the short call, while the strike price of the long put is lower than the strike price of the short put. Maximum gain is calculated using the shorter-term expiration. Maximum gain is the credit received. Loss is limited to the difference between the strike prices, less the credit received.
Option Approval level 3
WHY USE THIS STRATEGY
Traders with a neutral outlook may use this strategy when expecting the price of the underlying security to be between the middle strike prices at the near-term expiration, or as a way to potentially generate income.
EXAMPLE
- Long 1 XYZ 60-day 120 Put
- Short 1 XYZ 30-day 125 Put
- Short 1 XYZ 30-day 135 Call
- Long 1 XYZ 60-day 140 Call
P/L CHART
PROFIT LOSS
LOSSPotential goal
To profit from neutral stock price action between the strike prices of the short calls with limited risk.
Explanation
Example of double diagonal spread
Sell 1 28-day XYZ 95 put at 1.30
Buy 1 56-day XYZ 100 put at (3.80)
Buy 1 56-day XYZ 100 call at (4.00)
Sell 1 28-day XYZ 105 call at 1.50
Net cost = (5.00)
A double diagonal spread is created by buying one “longer-term” straddle and selling one “shorter-term” strangle. In the example above, a two-month (56 days to expiration) 100 Straddle is purchased and a one-month (28 days to expiration) 95 – 105 Strangle is sold. This strategy is established for a net debit, and both the profit potential and risk are limited.
Iron Condor - ** - dual credit strategy - as 1 loses, the other gains
Both an out-of-the-money call and put spread are sold simultaneously for a net credit.
Maximum profit is limited to the premium received.
Loss is limited to the difference between the strike prices, less the premium received.
Traders looking to generate income may use this strategy when their outlook is neutral or they expect volatility to be minimal.
EXAMPLE
- Long 1 XYZ 120 Put
- Short 1 XYZ 125 Put
- Short 1 XYZ 135 Call
- Long 1 XYZ 140 Call

Long Put Butterfly - risk mitigation
Strategy in which a trader is long and short four puts of three different strike prices with the same expiration.
One contract is bought at both the highest and lowest strike prices, while two contracts at the middle strike price are sold for a net debit.
Loss is limited to the net debit paid. Maximum profit is limited to the difference between the strike prices and the net debit paid.
Traders may use this strategy when they believe the security price will remain unchanged or move within a small range, finishing at or near the middle strike price.
EXAMPLE
- Long 1 XYZ 50 Put
- Short 2 XYZ 55 Puts
- Long 1 XYZ 60 Put
P/L CHART
PROFIT LOSS
LOSSShort Butterfly
Goal
To profit from a stock price move up or down beyond the highest or lowest strike prices of the position.
Explanation
Example of short butterfly spread with puts
Sell 1 XYZ 105 put at 6.25 6.25
Buy 2 XYZ 100 puts at 3.15 each (6.30)
Sell 1 XYZ 95 put at 1.25 1.45
Net credit = 1.20
A short butterfly spread with puts is a three-part strategy that is created by selling one put at a higher strike price, buying two puts with a lower strike price and selling one put with an even lower strike price. All puts have the same expiration date, and the strike prices are equidistant. In the example one 105 Put is sold, two 100 Puts are purchased and one 95 Put is sold. This strategy is established for a net credit, and both the potential profit and maximum risk are limited. The maximum profit is equal to the net premium received less commissions, and it is realized if the stock price is above the higher strike price or below the lower strike price at expiration. The maximum risk equals the distance between the center and lower strike prices less the net premium received, and a loss of this amount incurred if the stock price is equal to the center strike price (long puts) on the expiration date.
This is an advanced strategy because the profit potential is small in dollar terms and because "costs" are high. Given that there are three strike prices, there are multiple commissions in addition to three bid-ask spreads when opening the position and again when closing it. As a result, it is essential to open and close the position at "good prices." It is important to ensure the risk/reward ratio including commissions is favorable or acceptable.
Maximum profit
The maximum profit potential is the net credit received less commissions, and there are two possible outcomes in which a profit of this amount is realized. If the stock price is above the highest strike price at expiration, then all puts expire worthless and the net credit is kept as income. Also, if the stock price is below the lowest strike price at expiration, then all puts are in the money and the butterfly spread position has a net value of zero. As a result, the net credit less commissions is kept as income.
Maximum risk
The maximum risk is equal to the difference between the center and lowest strike prices less the net credit received minus commissions, and a loss of this amount is realized if the stock price is equal to the center strike price (long puts) at expiration.
In the example above, the difference between the center and lowest strike prices is 5.00, and the net credit received is 1.20, not including commissions. The maximum risk, therefore, is 3.80 less commissions.
Breakeven stock price at expiration
There are 2 breakeven points. The lower breakeven point is the stock price equal to the lower strike short put plus the net credit. The upper breakeven point is the stock price equal to the higher strike short put minus the net credit.
Short Iron Butterfly
Goal
To profit from neutral stock price action near the strike price of the short options (center strike) with limited risk.
Explanation
Example of short iron butterfly spread
Buy 1 XYZ 95 Put at 1.20 (1.20)
Sell 1 XYZ 100 Put at 3.20 3.20
Sell 1 XYZ 100 Call at 3.30 3.30
Buy 1 XYZ 105 Call at 1.40 (1.40)
Net Credit = 3.90
A short iron butterfly spread is a four-part strategy consisting of a bull put spread and a bear call spread in which the short put and short call have the same strike price. All options have the same expiration date, and the three strike prices are equidistant. In the example above, one 95 Put is purchased, one 100 put is sold, one 100 Call is sold and one 105 Call is purchased. This strategy is established for a net credit, and both the potential profit and maximum risk are limited. The maximum profit is realized if the stock price is equal to the strike price of the short options (center strike) on the expiration date. The maximum risk is the difference between the lower and center strike prices less the net credit received. The maximum risk is realized if the stock price is above the highest strike price or below the lowest strike price at expiration.
This is an advanced strategy because the profit potential is small in dollar terms and because “costs” are high. Given that there are four options and three strike prices, there are multiple commissions in addition to four bid-ask spreads when opening the position and again when closing it. As a result, it is essential to open and close the position at “good prices.” It is important to ensure the risk/reward ratio including commissions is favorable or acceptable.
Collar - buy put, sell call for stock owned - price insurance
used to protect a long equity position from a price decline at minimal cost
buy a put on long equity position
Straddle - debit or credit - buy or sell a put and a call at the ATM price
Goal
To profit from a big price change – either up or down – in the underlying stock.
Explanation
Example of long straddle
Buy 1 XYZ 100 call at (3.30)
Buy 1 XYZ 100 put at (3.20)
Net cost = (6.50)
A long straddle consists of one long call and one long put. Both options have the same underlying stock, the same strike price and the same expiration date. A long straddle is established for a net debit (or net cost) and profits if the underlying stock rises above the upper break-even point or falls below the lower break-even point. Profit potential is unlimited on the upside and substantial on the downside. Potential loss is limited to the total cost of the straddle plus commissions.
Maximum profit
Profit potential is unlimited on the upside, because the stock price can rise indefinitely. On the downside, profit potential is substantial, because the stock price can fall to zero.
Maximum risk
Potential loss is limited to the total cost of the straddle plus commissions, and a loss of this amount is realized if the position is held to expiration and both options expire worthless. Both options will expire worthless if the stock price is exactly equal to the strike price at expiration.
Breakeven stock price at expiration
There are two potential break-even points:
Strike price plus total premium:
In this example: 100.00 + 6.50 = 106.50
Strike price minus total premium:
In this example: 100.00 – 6.50 = 93.50
Strangle - debit or credit - buy or sell an OTM put and a OTM call
Goal
To profit from little or no price movement in the underlying stock.
Explanation
Example of short strangle
Sell 1 XYZ 105 call at 1.50
Sell 1 XYZ 95 put at 1.30
Net credit = 2.80
A short strangle consists of one short call with a higher strike price and one short put with a lower strike. Both options have the same underlying stock and the same expiration date, but they have different strike prices. A short strangle is established for a net credit (or net receipt) and profits if the underlying stock trades in a narrow range between the break-even points. Profit potential is limited to the total premiums received less commissions. Potential loss is unlimited if the stock price rises and substantial if the stock price falls.
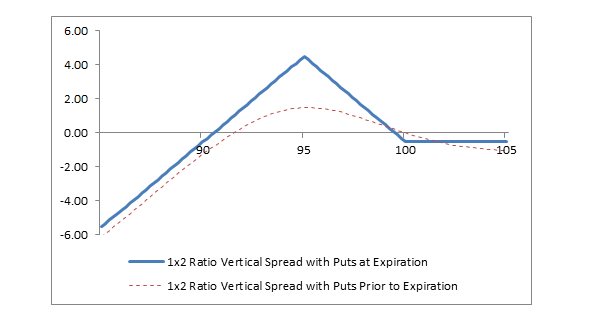
1X2 Ratio Vertical Spread
Potential goals
To profit from a stock price move to the strike price of the short puts with limited upside risk.
Explanation
Example of 1x2 ratio vertical spread with puts
| Buy 1 XYZ 100 put at 3.50 |
| Sell 2 XYZ 95 puts at 1.50 each |
A 1x2 ratio vertical spread with puts is created by buying one higher-strike put and selling two lower-strike puts. The second short put can either be cash-secured or uncovered (naked). This strategy can be established for either a net debit (as seen in the example) or for a net credit, depending on the time to expiration, the percentage distance between the strike prices and the level of volatility. Profit potential is limited, and the maximum profit is realized if the stock price is at the strike price of the short puts at expiration. Below the breakeven point risk is substantial, because the stock price can fall to zero.
Maximum profit
If the position is created for a net debit (cost), profit potential is limited to the difference between the strike prices minus the net debit including commissions. In the example above, the maximum profit is 4.50, because the higher strike price minus the lower strike price is 5.00 (100.00 – 95.00) and the net debit is 0.50. Therefore, 5.00 – 0.50 = 4.50.
If the position is created for a net credit (amount received), profit potential is limited to the difference between the strike prices plus the net credit less commissions. If the position had been established for net credit of 50 cents (0.50), the maximum profit would be 5.50, because the higher strike price minus the lower strike price is 5.00 (100.00 – 95.00) and the net credit would have been 0.50. Therefore, 5.00 + 0.50 = 5.50.
Maximum risk
On the downside, risk is substantial, because the risk of the short put is the same as the risk of long stock below the breakeven point.
On the upside, potential risk depends on whether the position is established for a net debit or a net credit. If established for a net debit, the maximum risk is equal to the net debit including commissions. If established for a net credit including commissions, there is no upside risk. If the stock price is above the higher strike price at expiration, then all puts expire worthless and the net credit is kept as a profit.
Breakeven stock price at expiration
If the position is established for a net debit, there are two breakeven points:
Higher breakeven point: Higher strike price minus the net debit
In this example: 100.00 − 0.50 = 99.50
Lower breakeven point: lower strike price minus the maximum profit
In this example: 95.00 − 4.50 = 90.50
If the position is established for a net credit, there is one breakeven point:
Assuming the position is established for a net credit of 50 cents (0.50):
Breakeven point: Lower strike price minus the maximum profit
95.00 − 5.50 = 89.50
Note: If this position is established for a net credit, there is no “higher breakeven point.” If the stock price is above the higher strike price at expiration, then all puts expire worthless, and the net credit is kept as profit.
Profit/Loss diagram and table: 1x2 ratio vertical spread with puts
| Buy 1 XYZ 100 put at 3.50 |
| Sell 2 XYZ 95 puts at 1.50 each |
Covered Call
generate added income on equity position
expect price to stay below call strike by expiration
#Pairs Trading - arbitrage 2 securities spread
https://www.fidelity.com/learning-center/trading-investing/trading/pairs-trading
In a nutshell, pairs trading works by betting that 2 or more securities will diverge or converge in price.
Pairs trading is a non-directional, relative value investment strategy that seeks to identify 2 companies or funds with similar characteristics whose equity securities are currently trading at a price relationship that is out of their historical trading range. This investment strategy will entail buying the undervalued security while short-selling the overvalued security, all while maintaining market neutrality. It can also be referred to as market neutral or statistical arbitrage.
Trading strategy
Pairs trading is a strategy that tends to use statistics to identify relationships, assist in determining the direction of the relationship, and then ascertain how to execute a trade based on the data. The pairs trader attempts to capitalize on market imbalances between 2 or more financial instruments, such as stocks or funds, in anticipation of making money when the inequality is corrected.
To measure these relationships, the pairs trader will use statistics, fundamentals, technical analysis, and even probabilities. One of the main keys to pairs trading is finding strong correlations between financial instruments, thus building a foundation for further analysis. The empirical data are then dissected to unearth information that allows the trader an efficient and methodical way of executing successful trades.
Pairs trading is by no means a holy grail of trading and will have its ups and downs, like any other trading style.
Pairs work is based on a correlation between 2 (or more) stocks, sectors, indexes, or other financial instruments. Think of a highway and the service road that often runs parallel to it. Generally, the service road follows the highway closely but terrain or development will sometimes cause the 2 to diverge. The area between the highway and the service road can be thought of as the spread—the measured distance between the 2 objects traveling together. The pairs trader attempts to measure the spread with statistics in an effort to find a tradable relationship of inequality opportunities.
In a nutshell, pairs trading works by betting that 2 or more securities will diverge or converge in price. The trader bets that a $50 stock and a $55 stock, for instance, will either have a larger or smaller spread ($5 in this case) when the trade is closed. Divergence traders will like to see the spread increase while convergence traders will prefer to see the spread decrease.
Anyone can use pairs trading but it has tended to be employed by professionals and those with a good understanding of short selling. Transforming pairs trading from a theoretical construct into a practical reality capable of generating profits will involve several steps:
Formulate the selection criteria
Generate a list of candidate trades
Perform technical, fundamental, or other statistical overlays
Execute the trade
Manage the trade
Close the trade
#Momentum trading
https://www.fidelity.com/learning-center/trading-investing/trading/momentum-trading-strategies
Momentum traders and investors look to take advantage of upward trends or downward trends in a stock or ETF's price. We've all heard the old adage, "the trend is your friend." And who doesn't like riding a trend? Momentum style traders believe that these trends will continue to head in the same direction because of the momentum that is already behind them.
Key - find trends, find reversals indicators
Consider average in and out strategies to "roll" positions
Look at volatility and stop loss orders
Momentum trading carries with it a higher degree of volatility than most other strategies. Momentum trading attempts to capitalize on market volatility. If buys and sells are not timed correctly, they may result in significant losses. Most momentum traders use stop loss or some other risk management technique to minimize losses in a losing trade.
Track trend indicators for stock, sector, market - technical and fundamental
indicators include - call / put ratio, high / low ratio, RSI, MACD, SMA crossovers ( 10 / 30 ), support / resistance, VIX changes,
Fundamental events >> avoid eps, check business events, economic impact events, regulatory events
Using Momentum Indicators to Manage Trades
Momentum Indicators
Momentum Oscillator
The Momentum Oscillator measures the amount that a security’s price has changed over a given period of time. The Momentum Oscillator is the current price divided by the price of a previous period, and the quotient is multiplied by 100. The result is an indicator that oscillates around 100. Values less than 100 indicate negative momentum, or decreasing price, and vice versa.
How this indicator works
- If the Momentum Oscillator reaches extremely high or low values (relative to its historical values), you should assume a continuation of the current trend.
- Since the Momentum oscillator does not have an upper and lower boundary you must visually inspect the history of the momentum line and draw horizontal lines along its upper and lower boundaries. When the momentum line reaches these levels it may indicate that the stock may be overbought or oversold.
Note: The Momentum Oscillator is an unbound oscillator, meaning there is no upside or downside limits. This makes interpreting an overbought or oversold condition subjective. When the Momentum Oscillator is overbought the security can continue to move higher. When the Momentum indicator is oversold the security can continue lower as well. Use the Momentum Oscillator in conjunction with additional indicators or price analysis when attempting to read overbought or oversold conditions. - If underlying prices make a new high or low that isn't confirmed by the Momentum Indicator, the divergence may signal a price reversal.
Williams R Indicator
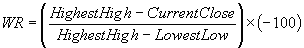
Williams %R is a momentum indicator that is the inverse of the Fast Stochastic Oscillator. Readings from 0 to -20 are considered overbought. Readings from -80 to -100 are considered oversold. Williams %R reflects the level of the close relative to the highest high for the look-back period. This is a bound oscillator and oscillates from 0 to -100. As a result, the Fast Stochastic Oscillator and Williams %R produce the exact same lines, only the scaling is different. Williams %R corrects for the inversion by multiplying the raw value by -100.
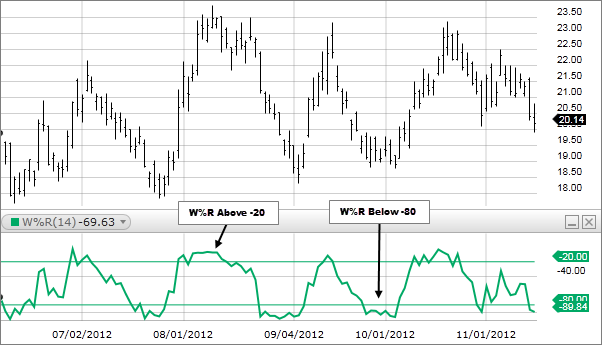
How this indicator works
- Williams %R moves between 0 and -100, which makes -50 the midpoint.
- A Williams %R cross above -50 signals that prices are trading in the upper half of their high-low range for the given look-back period (Bullish).
- Conversely, a cross below -50 means prices are trading in the bottom half of the given look-back period (Bearish).
- Readings above -20 for the 14-day Williams %R would indicate that the underlying security was trading near the top of its 14-day high-low range.
- Readings below -80 occur when a security is trading at the low end of its high-low range.
- Default settings use -20 as the overbought threshold and -80 as the oversold threshold. These levels can be adjusted depending on the security’s characteristics.
- Note: Keep in mind that even though a security is overbought or oversold it can remain in this state for an extended period of time. When using any indicator it is best to use an additional indicator to confirm any signals.
- When Williams % R moves above -20 and then, in the next move up, fails to move above -20, this can indicate weakening momentum to the upside. Conversely, when Williams % R moves below -80 and then, in the next move down, fails to move below -80, this can indicate weakening momentum to the downside.
Stochastics Indicator
https://www.fidelity.com/viewpoints/active-investor/trading-with-stochasticsIf stocks are closer to trading "normally," you can use indicators to value the market again.
Similar to the Relative Strength Index (RSI) and Moving Average Convergence/Divergence (MACD), stochastics is a momentum measure that ranges from 0 to 100. The reason why momentum indicators like stochastics are considered more useful in sideways markets, compared with uptrends or downtrends, is due to the nature of the way they oscillate between relatively overbought and oversold prices. If you add this indicator to your charts, stochastics can typically be found beneath the price chart (see Stochastics applied to the S&P 500 below).
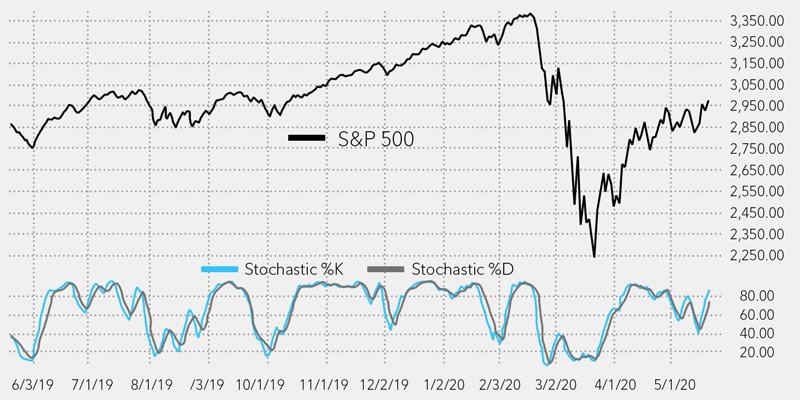
Stochastics is actually made up of 2 lines, which tend to move in tandem. %K (light blue line in the chart above) represents the level of the stock or index's closing price relative to the high and low range over a specified period of time, and %D (gray line in the chart above) attempts to smooth out the %K line by taking a 3-day moving average of the %K line. Consequently, %D is generally considered the more important of the 2 lines.
The theory behind stochastics is that these lines generate buy or sell signals when closing prices are near recent extreme highs or lows (i.e., sell signals after an uptrend and buy signals after a downtrend). Note that the time frame you pick when using stochastics, or other indicators/fundamentals, is at your discretion.
Generally, the area above 80 indicates an overbought region, while the area below 20 is considered an oversold region. When stochastics is above 80 and moves below that number, it indicates a sell signal. When stochastics is below 20 and moves above that number, it indicates a buy signal. 80 and 20 are the most common signal levels used, but can be adjusted per individual preferences.
What stochastics says about stocks now
Looking at the chart above of the S&P 500, recent signals given by stochastics were a buy signal in March (just ahead of the near-term COVID-19 market bottom) when both lines dropped below and subsequently crossed above 20, and a sell signal in late April when both lines crossed above and subsequently dropped below 80. This past week, both stochastics lines have reapproached oversold territory.
Another pattern that has emerged is a divergence between the direction of the stochastics indicator and the S&P 500. Divergences form when a new high or low in price is not confirmed by a new high or low in stochastics. A bullish divergence forms when price makes a lower low but stochastics forms a higher low. This could indicate less downward momentum and could foreshadow a bullish reversal. In the chart you can see that stochastics have made lower lows and lower highs (a bearish signal).
This suggests, based on this indicator alone, that the short-term outlook may be bearish. Indeed, as the economy begins to open back up, there is significant uncertainty as to the pace of a recovery as well as COVID-19 infection rates.
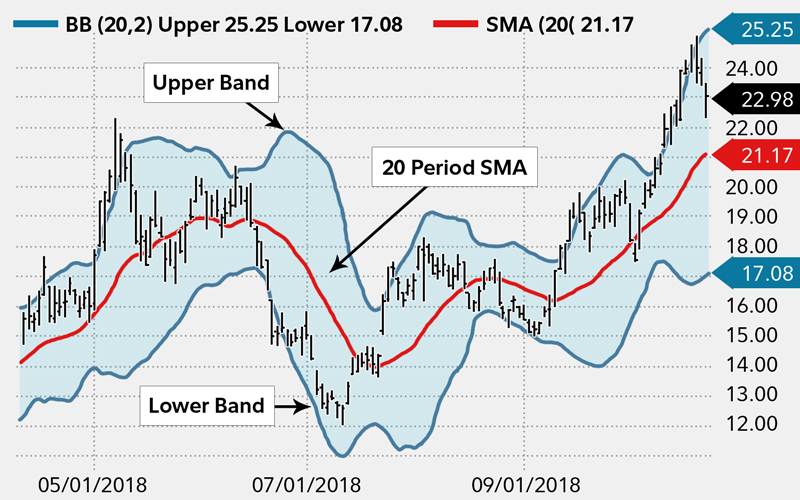
Bollinger Bands
https://www.fidelity.com/viewpoints/active-investor/understanding-bollinger-bands
The Bollinger Band® indicator suggests stocks may be oversold over the short term.
Key takeaways
Bollinger Bands® can help you assess the relative strength of an investment over the short term.
Active buy and sell signals can be produced.
This indicator suggests US stocks may be oversold over the short term.
US stocks had their second pullback (a decline between 5% and 10%) of 2019, measured from the all-time high set on July 26. Investors are grappling with a lot right now—global trade wars, uncertain monetary policy, a bull market in its 10th year, the maturing business cycle, and most recently, the inversion of the yield curve. Yet US stocks are still up 13% year to date on a price return basis, as the long-term bullish momentum has persisted upon mostly strong corporate earnings. Where will stocks go from here?
It can be difficult for active investors making short-term trades to determine what the short-term trend of the market may be. Similarly, how do you determine if an individual stock price is relatively high or low? Is a stock that is trading at $50 a share high, or is it low, relative to its recent price range? You may have done your research and decided to buy or sell. But when is the best time to pull the trigger?
Bollinger Bands® are one tool that can help you decide when to make your move by illustrating the relative strength—or momentum—of a stock or other investment. You can even apply this indicator to the broad market. Currently, Bollinger Bands suggest that US stocks, broadly speaking, may be oversold on a short-term basis (more on this shortly). Of course, you should never rely on a single piece of information to make an investment decision. It's always important to consider fundamental stock research and your particular goals, time horizon, and risk tolerance before making an investment decision.
Using Bollinger Bands
Bollinger Bands look like an envelope that forms an upper and lower band* around the price of a stock or other security (see the chart below). Between the 2 bands is a moving average, typically a 20-day simple moving average (SMA).
Trade Plans
Plan the entry, the management and the exit strategies
https://www.fidelity.com/learning-center/tools-demos/trading-tools/options-trading-roadmap
Entry strategy
Buy on weakness or strength
buy at market or buy stop
Exit strategy
know going into the trade at what point (or conditions) you will take profits and at what point (or conditions) you will exit with a loss.
set alerts, check trends, make clear decisions to minimize a loss
make clear decisions to take profits in full or partial near resistance levels
3 routes you can take when managing an open options position: Wait, close, or roll.
Profit and Loss Calculator for an Option Trade Strategy
can define an option trade strategy, vary prices etc to see profit and loss impacts
Probability Calculator for prices on a date
Margin Calculator - identify how much you can invest given margin equity balance
you can model a trade to see the margin impact before placing the trade
Tax deferred accounts require cash settled options for spreads
max loss is the cash held to cover the option position until close or expiration
Trade Management Strategies
Track price probabilities for trade prices, strikes
Set price alerts to analyze and manage trades
Use technical, fundamental analytics to estimate price trend to expiration
Reactive Trade Management
ID trends, Support and Resistance Indicators for momentum, risks
Grey Swan Events
Normally planned for in trade scenarios and trade management
Generally limited risk strategies with higher win probabilities should average out well over time
Small momentum strategies can reduce losses, increase gains
Black Swan Events
Have you identified potential Black Swan Events?
Massive impact events that are normally low probability ( eg COVID, MBS market collapse etc )
Market Black Swan Risks
Sector Black Swan Risks
Firm Black Swan Risks
if fraud or class action law suit, low chance of recovery on PE compression
Check Black Swan History
Market events
Are the market black swan events short-term or long-term normally
2008 was long-term
COVID was medium term
Firm events
A financially healthy firm, Black Swan events are normally shorter term
Trade Alerts
Review Trade Alerts
Trade analysis
ID Price action points
ID momentum confirmation factors
ID short-term sentiment changes
Review fundamental impact factors
market > sector > firm deltas
Price - Date probability changes
set or move stops
consider momentum trades - SSO , SDS on average in or out
Trade Exit Strategies
Sell at Target Gain
Sell at a loss
partial average out
set sell stops to cut loss at risk of greater loss
open the spread to reduce the loss if price continues the losing trend
Trade Adjustment Strategies
Trade Conversion Strategies
Example 1 - Roll T to CFG keeping same income flow
on 7/1/20 ...
T was 28 at 7 pct
CFG was 25 at 6.4 pct
could roll ALL T to CFG with same income
which was:
- stronger business fundamentals ?
- low downside risk?
Clearly CFG was the smart choice
What happened?
T was flat in 6 months
CFG went up 60%
Potential Value Opportunities
Dividend Kings
2023 Dividend Kings List
https://www.suredividend.com/dividend-kings/
- How To Use The Dividend Kings List To Find Dividend Stock Ideas
- The 5 Best Dividend Kings Today
#5: Sysco Corp. (SYY)
#4: Johnson & Johnson (JNJ)
#3: Altria Group (MO)
#2: Lowe’s Companies (LOW)
#1: 3M Company (MMM) - Analysis Reports On All 48 Dividend Kings
- Performance Of The Dividend Kings
- Sector & Market Capitalization Overview
- Final Thoughts
Dividend Kings List - Motley Fool
https://www.fool.com/investing/stock-market/types-of-stocks/dividend-stocks/dividend-kings/
| DIVIDEND KING | SECTOR | DIVIDEND INCREASE STREAK |
|---|---|---|
| American States Water (NYSE:AWR) | Utilities | 68 |
| Dover Corporation (NYSE:DOV) | Industrials | 67 |
| Northwest Natural Holding (NYSE:NWN) | Utilities | 67 |
| Genuine Parts (NYSE:GPC) | Consumer Goods | 66 |
| Procter & Gamble (NYSE:PG) | Consumer Goods | 66 |
| Parker Hannifin (NYSE:PH) | Industrials | 66 |
| Emerson Electric (NYSE:EMR) | Industrials | 66 |
| 3M (NYSE:MMM) | Industrials | 64 |
| Cincinnati Financial (NASDAQ:CINF) | Financials | 61 |
| Johnson & Johnson (NYSE:JNJ) | Healthcare | 60 |
| Coca-Cola (NYSE:KO) | Consumer Goods | 60 |
| Lancaster Colony (NASDAQ:LANC) | Consumer Goods | 60 |
| Colgate-Palmolive (NYSE:CL) | Consumer Goods | 59 |
| Nordson (NASDAQ:NDSN) | Industrials | 59 |
| Farmers & Merchants Bancorp (OTH:FMCB) | Financials | 57 |
| Hormel Foods (NYSE:HRL) | Consumer Goods | 56 |
| ABM Industries (NYSE:ABM) | Industrials | 56 |
| California Water Service Group (NYSE:CWT) | Utilities | 55 |
| Stanley Black & Decker (NYSE:SWK) | Industrials | 55 |
| Stepan Company (NYSE:SCL) | Industrials | 55 |
| Federal Realty Investment Trust (NYSE:FRT) | Real Estate | 55 |
| Commerce Bancshares (NASDAQ:CBSH) | Financials | 54 |
| SJW Group (NYSE:SJW) | Utilities | 54 |
| Sysco (NYSE:SYY) | Consumer Goods | 53 |
| MSA Safety (NYSE:MSA) | Industrials | 53 |
| H.B. Fuller (NYSE:FUL) | Materials | 53 |
| Altria Group (NYSE:MO) | Consumer Goods | 53 |
| National Fuel Gas (NYSE:NFG) | Energy | 52 |
| Universal Corporation (NYSE:UVV) | Consumer Goods | 52 |
| Black Hills Corp. (NYSE:BKH) | Utilities | 52 |
| Illinois Tool Works (NYSE:ITW) | Industrials | 52 |
| W.W. Grainger (NYSE:GWW) | Industrials | 51 |
| Target (NYSE:TGT) | Consumer Goods | 51 |
| Leggett & Platt (NYSE:LEG) | Industrials | 51 |
| PPG Industries (NYSE:PPG) | Industrials | 51 |
| Computer Services, Inc. (OTV:CSVI) | Technology | 51 |
| Becton, Dickinson & Co. (NYSE:BDX) | Healthcare | 51 |
| AbbVie (NYSE:ABBV) | Healthcare | 51 |
| Abbott Labs (NYSE:ABT) | Healthcare | 51 |
| Tennant (NYSE:TNC) | Industrials | 50 |
| Kimberly Clark (NYSE:KMB) | Consumer Goods | 50 |
| PepsiCo (NASDAQ:PEP) | Consumer staples | 50 |
| Nucor (NYSE:NUE) | Industrials | 50 |
Mega trends to review
- slower population growth in developed countries
- global connectivity and communications increasing
- aging populations
- greater environment challenges ( global warming, sea levels, pollution, waste, scarcities sustainable practices etc )
- growing dependencies and risks on networks and integration
- smarter, automated software solutions provide benefits with some risks
- lower average relative value for college educations
- higher demand for certifications, training, skills
- more efficient, shorter supply chains reduce costs, risks
- increased challenges of illegal migration ( costs, risks, security )
- continued decrease in trust in government, media, global business
- continued improvement in global healthcare with differences in access
- lower overall focus on individual responsibility and accountability
- increased growth of government budgets and debt compared to GDP threatens economic health and sustainability
- tax policies in many countries increasing risks and problems
- increased social polarization within most countries weakening democracies overall
- improvements in social justice and increased crime with the US
- overall reduction in social tolerance lowering open communications, trust
- risks of globalization increasing
- value of international organizations less clear
- motivation and value for work decreasing overall - the great resignation increasing economic inequality
- increased automation slowly reduces net work opportunities increasing economic inequality
- fewer countries succeeding at democratic capitalism
- more people are finding less purpose in their lives outside themselves
- trust in technology is growing while trust in people is declining
- greater social diversity impacts consensus on common values
Potential Challenges
Candidate Solutions
Trade Settlement Process
https://www.dtcc.com/understanding-settlement/index.html

CCP - Central Counterparty
https://www.investopedia.com/terms/c/ccph.asp
A central counterparty clearing house (CCP) is an entity that helps facilitate trading in various European derivatives and equities markets. Typically operated by the major banks in each country, CCPs strive to introduce efficiency and stability into various financial markets. It reduces counterparty, operational, settlement, market, legal, and default risk for traders.
- A central counterparty clearing house (CCP) is an organization, usually operated by a major bank, that exists in European countries to help facilitate derivatives and equities trading.
- Central counterparty clearing houses (CCPs) perform two primary functions as the intermediary in a transaction: clearing and settlement.
- A CCP acts as a counterparty to both sellers and buyers, collecting money from each, which allows it to guarantee the terms of a trade.
the Post Trade Distributed Ledger Group, which studies how blockchain technology can affect the way in which security trades are cleared, settled, and recorded.
Blockchain for settlement and clearing
The PTDL Group believes new technology can reduce risk and margin requirements, save on operational costs, increase settlement cycle efficiency, and facilitate greater regulatory oversight—both before and after trading. And because this group’s members represent various parts of the securities settlement process, they comprehensively understand how the blockchain technology can aid the settlement, clearing, and reporting processes
- The ledger itself, which contain a history of all transactions, contract terms and programmable instructions, or “smart contracts,” to use for payment of coupons or automatic enforcement of exchanges within the ledger.
- “Nodes” which are assigned various rights and tasks -- administrator, issuer, proposer, validator and auditor -- for generating the consensus that certifies the ledger.
- Cryptography, employed to secure a DL and serve as a gatekeeper for access to the DL.
- Tokenization, the digital representation of real-world assets within a DL, analogous to the dematerialization of share certificates within DTCC.
Simply put, in a DL’s nodal system, nodes can certify parties’ transactions as they are entered into the DL, reducing or eliminating the need for costly and time-consuming reconciliations. Nodes also let the DL be a golden data source for all members, reducing reconciliation to the individual books and records of member firms.
However, as revealed in the white paper by Greenwich Associates, DLT’s weaknesses at the payment and funding stages of settlement can undermine its potential for replacing the current system.
DLT’s real-time settlement would mark a reversion to pre-1891 bilateral gross settlement, requiring that all transactions in the U.S. market be funded on a transaction-by-transaction basis, losing the liquidity and risk-mitigating benefits of today’s netting features.
Further, instantaneous settlement makes it impossible to fund trading on a secured basis, because it doesn’t allow traders to pledge shares they have yet to transact as collateral. What this means is that all trades using DLT must be prefunded, and on an unsecured basis. This would severely limit market liquidity – as medieval Venetians learned before correcting this shortcoming in the late 1500s.
Project ION DLT trade platform
Specifically modeled around a netted T+0 settlement cycle — but capable of supporting T+2, T+1, T+0 or extended settlement cycles — the Project Ion platform is designed to:
- Provide a clearance and settlement option for the industry leveraging DTCC’s core benefits of risk management and volume capacity, including netting and the trade guarantee of the CCP.
- Support new features, with seamless interoperability between the Project Ion platform and the classic settlement platforms at The Depository Trust Company (DTC).
- Ensure adherence to DTCC’s rigorous regulatory standards across resiliency, stability, security, risk, and controls.
As described in a new white paper, “Building the Settlement System of the Future,” the first phase of the Project Ion platform will support bilateral deliver order transactions that will be initiated by pilot participants through client nodes hosted by DTCC. Once launched, the transactions will be processed through the Project Ion platform and then passed to DTC’s existing systems for settlement processing. The Project Ion platform is anticipated to be launched in the first quarter of 2022, and will serve as a parallel book and infrastructure for limited bilateral transactions on DLT, with DTC’s existing systems continuing to remain the authoritative source of transactions.
Clearing
Clearing is when an organization acts as an intermediary to reconcile orders between transacting parties. A clearing bank approves checks for payments
Settlement example
For example, when an investor places an order through their broker—and the trade is made between that broker and another broker or similar financial professional—information about that trade is sent to the NSCC (or an equivalent clearinghouse) for clearinghouse services.
After the NSCC has processed and recorded the trade, they provide a report to the brokers and financial professionals involved. This report includes their net securities positions after the trade and the money that is due to be settled between the two parties.
At this point, the NSCC provides settlement instructions to the DTCC; the DTCC transfers the ownership of the securities from the selling broker's account to the account of the broker who made the purchase. The DTCC is also in charge of transferring funds from the buying broker's account to the account of the broker who made the sale. The broker is then responsible for making the appropriate adjustments to their client's account. This entire process typically happens the same day the transaction occurs. The process for institutional investors is similar to the process for retail investors.
Data Services
https://dtcclearning.com/products-and-services/dtcc-datapro.html
DTCC Data Services offers referential and activity-based data provisioning that delivers fixed and configurable data solutions sourced from DTCC’s transaction, reference, position and asset servicing data covering all major asset classes.
As the largest depository in the world and the primary infrastructure in the U.S. for clearing, settlement and asset servicing, DTCC is uniquely positioned to deliver the timely, reliable data firms are seeking to help them reduce risks, cut costs, increase operational efficiencies and enhance the quality of their market insights.
The DTCC Data Services offerings provides streamlined access to up-to-date information sourced directly from DTCC’s trade-processing and data repository engines
Future Settlement System Model
Project Ion commits to successfully:
• Offering a clearance and settlement option for the industry that will never compromise on DTCC’s core benefits of risk management and volume capacity, including netting and the trade guarantee of the CCP.
• Supporting new features, with seamless interoperability between the Project Ion platform and classic settlement platforms.
• Building and implementing a platform that ensures adherence to DTCC rigorous regulatory standards across resiliency, stability, security, risk, and controls.
• Providing for optional adoption of the technology, the Project Ion platform will interoperate with DTCC’s existing technology while the industry advances to full adoption.
ION path to production
The MVP, scheduled for pilot release in 1Q 20229, will support bilateral deliver order transactions that will be initiated by pilot participants through client nodes hosted by DTCC.
• A Project Ion-submitted transaction will be processed through the Project Ion platform and then passed on to classic DTC systems for settlement processing.
• As the Project Ion-submitted transaction is processed by the classic DTC systems, status change messages will be sent back to the Project Ion platform and posted on the Project Ion ledger.
• The MVP will allow participants to access a parallel infrastructure and records for limited bilateral transactions.
• The classic DTC systems will remain the authoritative source for all transactions, including Project Ion submitted transactions.
Subsequent phases will extend the functionality of the infrastructure and record keeping. Later phases are expected to extend functionality over time to realize the reconciliation efficiencies offered by DLT. Expansion phases are likely to include provision of access through a client-hosted node, expand the transaction types processed by the Project Ion platform and see increased adoption of the functionality by clients.
Step-by-step guide for Example
sample code block